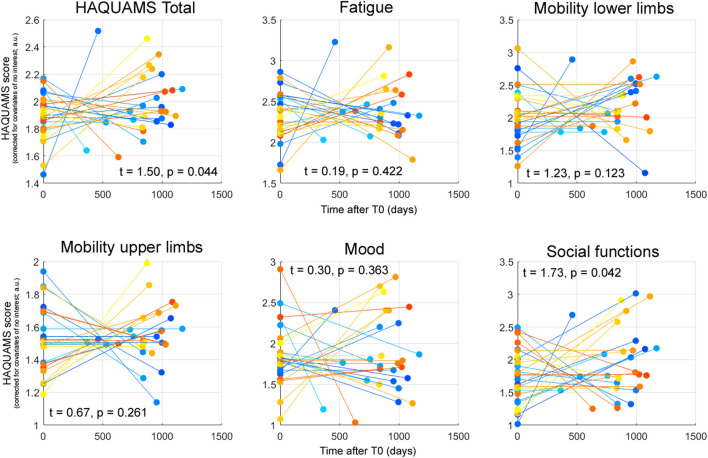
Figure 3.
Patient-specific HAQUAMS scores for overall HRQoL and five HAQUAMS subscales at T0 and T1 corrected for the CNI mentioned in the text. Each line depicts the trajectory of the given marker for an individual participant. The t-statistics and p-values reported characterizing the effect of time on each given parameter across all 28 PwMS. It is noted that higher scores correspond to less HRQoL, positive t-statistics to a (not necessarily significant) increase of a marker across time (and thus to a not necessarily significant HRQoL worsening).

