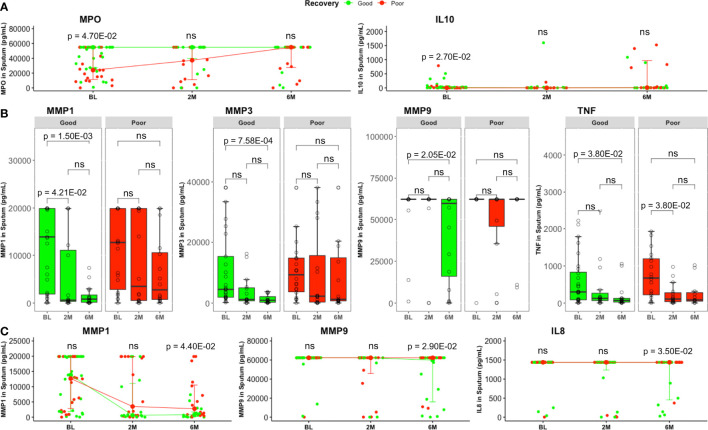
Figure 2.
Comparison of sputum inflammatory mediator levels between good and poor lung recovery groups with treatment time. (A) MPO and IL10 were higher in good (BL, n = 29; 2M, n = 16; 6M, n = 16) compared to poor (BL, n = 22; 2M, n = 16; 6M, n = 16) lung recovery groups at baseline. Data represent median [IQR]. Differences between lung pathology groups at any given time point were compared using the Wilcoxon signed rank test. (B) Most MMP1, 3, 9, and TNF levels were significantly lower at month 6 compared to baseline in patients with good lung recovery but not in those with poor lung recovery. Boxes represent the first and third quartiles and horizontal bars within indicate median concentration. Whiskers indicate minimum and maximum values. Each dot represents one individual patient. Kruskal–Wallis test with Dunn’s post-test comparison was performed to analyse differences between time points. (C) At the end of standard TB treatment, MMP1, MMP9 and IL8 concentrations were still higher in patients with poor lung recovery compared to those with poor lung recovery. Groups were compared using the Wilcoxon signed rank test. Data represent median [IQR]. ns, not significant.

