. 2021 Jun 22;20(9):1614–1626. doi: 10.1158/1535-7163.MCT-20-0502

Figure 6.

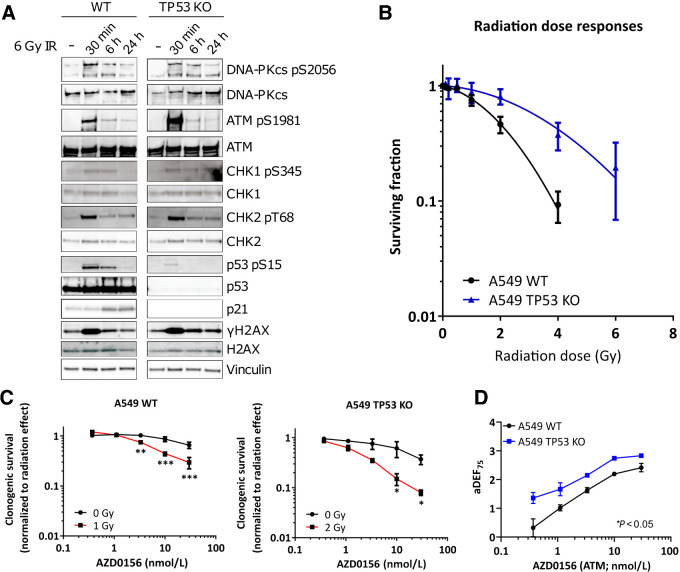
Figure 6. Characterization of A549 WT and A549 TP53 KO isogenic cell pair. A, Cell lines were treated with a 6 Gy dose of radiotherapy and analyzed at the times indicated. Cell extracts were western blotted for total and phosphorylated (p-) proteins. Vinculin served as a total loading control. B, Clonogenic survival of cell lines after exposure to increasing doses of radiotherapy. C, Clonogenic survival (normalized to untreated DMSO controls of the respective radiotherapy treatment) of cell lines in response to concentrations indicated for AZD0156 alone (black line; 0 Gy) or after radiotherapy at the doses indicated (red line). D, Approximate radiotherapy DEFs at 75% (aDEF75) of each concentration of AZD0156 as determined in (C), with overall dose enhancement determined as significantly greater in TP53 KO cells. Graphs in B–D represent the medians of two independent experiments performed in triplicate, with error bars representing upper and lower limits. Statistical significance was tested using a two-way ANOVA and is indicated where *, P < 0.05; **, P < 0.01; or ***, P < 0.001.

Characterization of A549 WT and A549 TP53 KO isogenic cell pair. A, Cell lines were treated with a 6 Gy dose of radiotherapy and analyzed at the times indicated. Cell extracts were western blotted for total and phosphorylated (p-) proteins. Vinculin served as a total loading control. B, Clonogenic survival of cell lines after exposure to increasing doses of radiotherapy. C, Clonogenic survival (normalized to untreated DMSO controls of the respective radiotherapy treatment) of cell lines in response to concentrations indicated for AZD0156 alone (black line; 0 Gy) or after radiotherapy at the doses indicated (red line). D, Approximate radiotherapy DEFs at 75% (aDEF75) of each concentration of AZD0156 as determined in (C), with overall dose enhancement determined as significantly greater in TP53 KO cells. Graphs in B–D represent the medians of two independent experiments performed in triplicate, with error bars representing upper and lower limits. Statistical significance was tested using a two-way ANOVA and is indicated where *, P < 0.05; **, P < 0.01; or ***, P < 0.001.