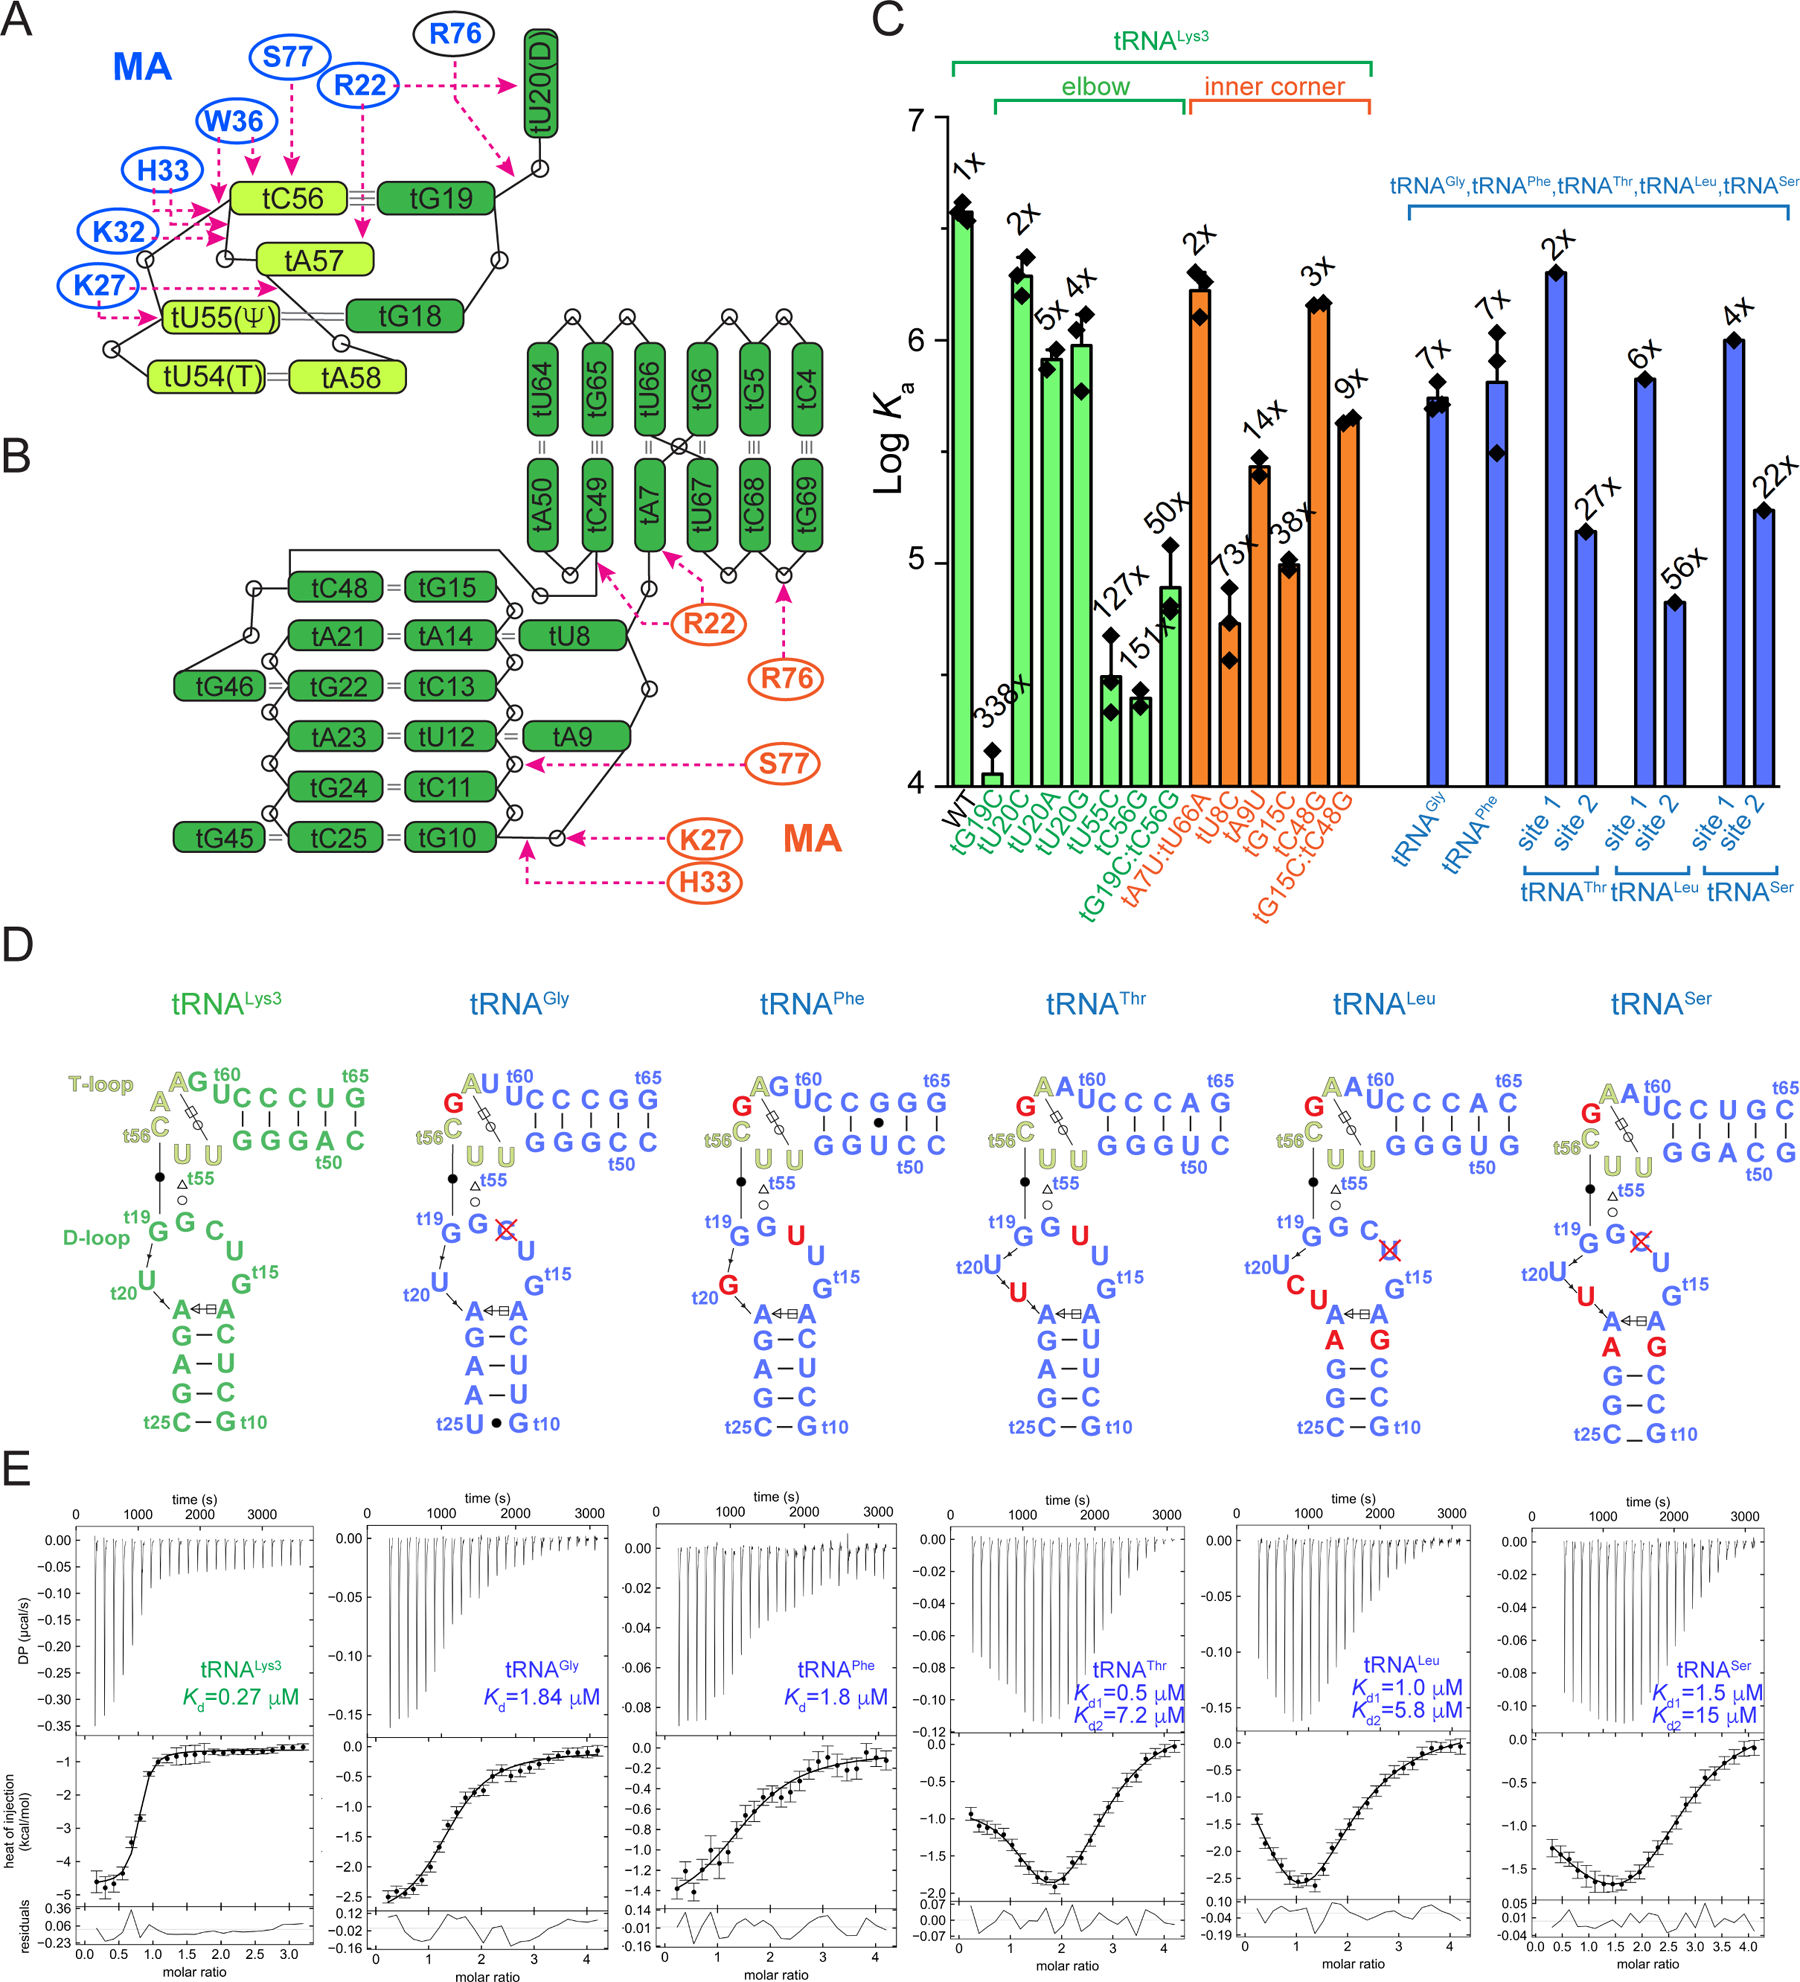
Figure 3. tRNA determinants for MA binding.

(A & B) Schematic representations of MA-tRNALys3 interactions at the elbow (A) and inner corner (B). The T-loop motif (t54-t58) is shown in light green.
(C) Mutational and ITC analyses of human tRNALys3, tRNAGly, tRNAPhe, tRNAThr, tRNALeu and tRNASer. Data are represented as mean ± s.d.
(D) Secondary structures of the elbow regions of the six tRNAs assayed in (C). Red crosses denote deletion.
(E) Representative ITC isotherms of MA binding to the six tRNAs in (D). The error bars indicate uncertainties in individual injection heats estimated by NITPIC (Methods).
