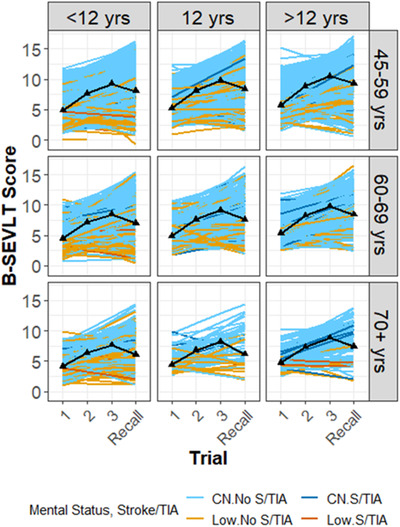
FIGURE 1.

Profiles of B‐SEVLT performance over the three learning trials and recall trial by age (rows), educational groups (columns), and cognitive status (based on the Six‐Item Screener ≤4) and self‐reported stroke/TIA (see legend below). Black curved lines denote average performance for each trial and recall. B‐SEVLT = Brief Spanish‐English Verbal Learning Test; CN = cognitively normal (Six‐Item Screener > 4); Low = low cognitive status (Six‐Item Screener ≤ 4); S/TIA = stroke/transient ischemic attack; yrs = years
