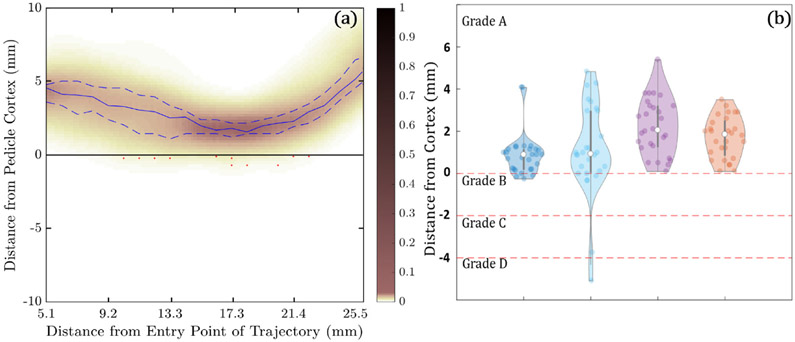
Figure 10.
Conformance of automatically planned trajectory centerlines and screws within bone corridors in the clinical CBCT study. (a) Heatmap probability distribution of the distance of the planned trajectory centerlines to the pedicle cortex as a function of distance along the trajectory. The solid blue line indicates the median distance, and the dashed blue lines indicate the interquartile range. Red markers indicate breaches of the cortical wall. (b) Violin plots of the minimum distance of planned screws to the medial, lateral, superior, and inferior cortical walls, along with GB classifications.

