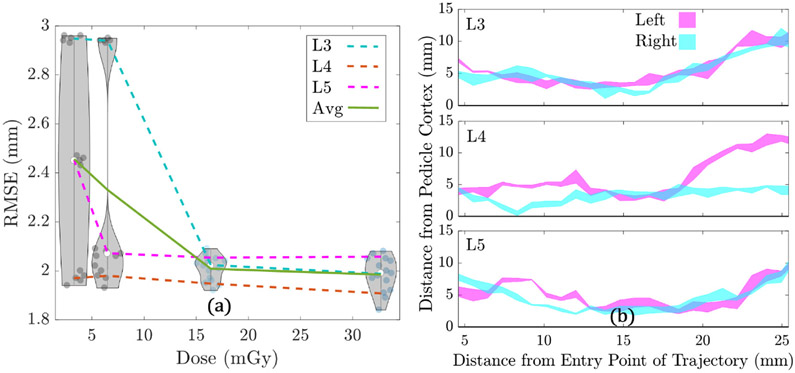
Figure 11.
Automatic planning in low-dose CBCT. (a) RMSE versus dose level for the low-dose CBCT study. Violin plots represent the distributions at each dose level for all 3 vertebrae, with a total of 5 runs performed for each vertebrae (3 vertebrae × 5 runs = 15 total runs). (b) Interval plot for left and right trajectories, for L3–L5, in the low-dose cone-beam CT study. The intervals represent the range of distance profiles across all 4 dose levels.

