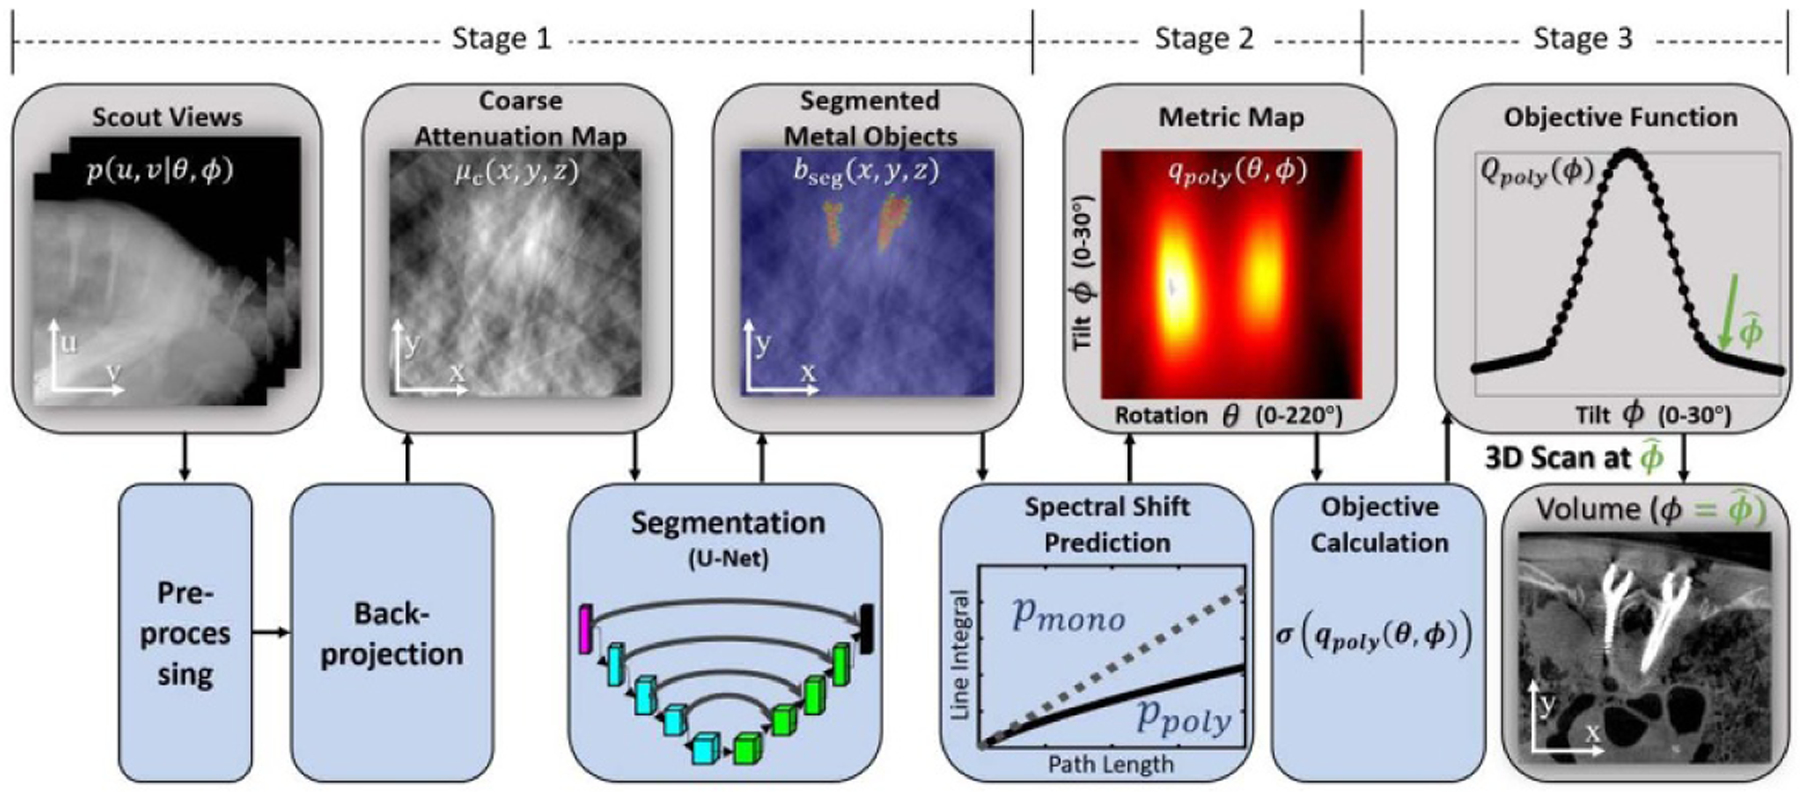
Figure 2.

Flowchart for the MAA algorithm. Scout views (2 or more) are pre-processed and backprojected to form a coarse attenuation map (μc), which is segmented using a U-Net to localize metal objects (bseg). Biases associated with spectral shift are then predicted as a function of gantry rotation (θ) and tilt (ϕ) angles to yield a metric map, denoted qpoly(θ, ϕ). An orbit that minimizes metal artifacts is determined by finding a path in qpoly(θ, ϕ) that minimizes errors and/or bias associated with the presence of metal (e.g. finding a path that minimizes the standard deviation (σ) of qpoly). A horizontal row in qpoly(θ, ϕ) represents a circular orbit at gantry tilt ϕ, and a curved path in qpoly(θ, ϕ) represents a noncircular orbit.
