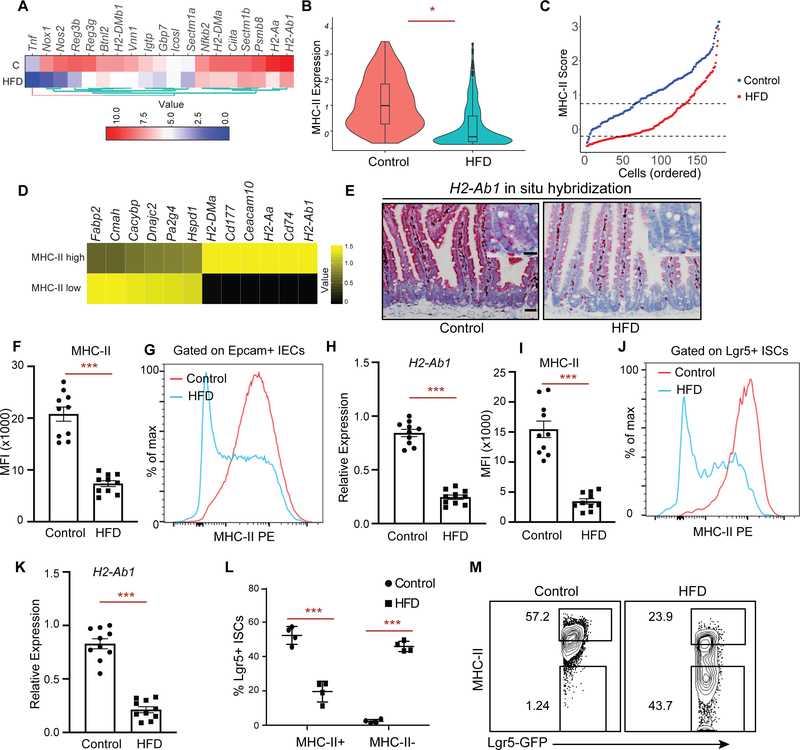
Figure 1 |. High Fat Diet reduces MHC-II expression on Lgr5+ intestinal stem cells (ISCs).
A. A heat map of downregulated genes assessed by bulk RNA-seq in Lgr5-GFPhi intestinal stem cells (Lgr5+ ISCs) isolated from long-term high fat diet (HFD)-fed mice compared to control mice (n=2). Scale represents computed z-scores of log10 expression values.
B. Violin plots demonstrating MHC-II expression in single Lgr5+ ISCs isolated from control (n=171 cells, 2 independent experiments) or HFD mice by single cell RNA-seq (scRNA-seq) (n=144 cells, 2 independent experiments).
C. Control (blue) and HFD (red) Lgr5+ ISCs ranked according to their expression of MHC II pathway genes (y-axis). Dashed lines correspond to y-intercepets of −0.2 and 0.75, which are the 25th and 75th percentile of scores in HFD cells, used to define MHC-II low (score < −0.2) and MHC-II high (score > 0.75) HFD cells. In contrast, these values correspond to 1st and 35th percentile of scores in control cells.
D. Heatmap showing differentially expressed (DE) genes (rows) between MHC-II low and MHC-II high HFD ISCs as defined in panel C. Scale represents computed z-scores of log10 expression values.
E. Single-molecule in situ hybridization of MHC-II (H2-Ab1) in control and HFD mice (n=5).
F, G. Mean fluorescence intensity (MFI) of MHC-II in Epcam+ intestinal epithelial cells (IECs) from crypts of control and HFD mice (F, n=10 mice, mean ± s.e.m.). Representative flow cytometry histogram plots of MHC-II expression in Epcam+ IECs (G).
H. Relative expression of MHC-II (H2-Ab1) in Epcam+ IECs isolated from crypts of control and HFD mice (n=10 mice, mean ± s.e.m.).
I, J. Mean fluorescence intensity (MFI) of MHC-II in Lgr5+ ISCs from crypts of control and HFD mice (I, n=10 mice, mean ± s.e.m.). Representative flow cytometry histogram plots of MHC-II expression in Epcam+ cells (J).
K. Relative expression of MHC-II (H2-Ab1) in Lgr5+ ISCs isolated from crypts of control and HFD mice (n=10 mice, mean ± s.e.m.).
L, M. Frequency of MHC-II+ and MHC-II− Lgr5+ ISCs in control and HFD mice by flow cytometry (L, n=4, mean ± s.d). Representative flow cytometry plots of MHC-II in control and HFD ISCs (M).
*P < 0.05, **P < 0.01, ***P < 0.001 (Student’s t-tests). Scale bars, 50 μm (E) and 20 μm (E, inset).

