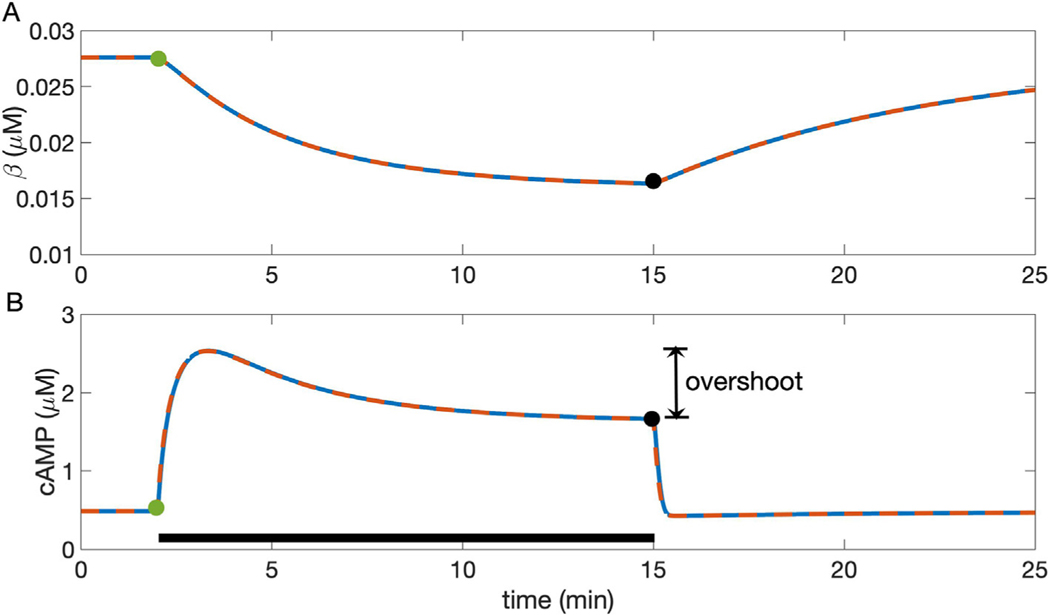
Fig. 2.
Predictions for cellular response to a change from basal conditions to 100 nM NE and subsequent return to 0 NE in the full (solid blue line) and reduced (dashed red line) Soltis-Saucerman model. Agonist is applied from 2 to 15 min of the simulation (black bar in B). A: both models predict a slow decrease in β upon application of NE, followed by a slow increase when NE is removed. B: in both models, cyclic AMP concentration transiently increases for 1–2 min and then gradually decays to a steady state in the presence of a high NE concentration. Overlay includes the trajectory from Fig. S1, panel A in Saucerman et al. (2004) and data (circles), taken from Hayes et al. (1980). Vertical double-arrow depicts “overshoot,” the difference between transient maximum and elevated steady state. Removal of NE leads to a small undershoot and return to the basal steady state. The models show nearly identical outputs, indicating that the reduction does not substantially change predictions. Green and black circles indicate steady-state values of variables for NE− and NE+ conditions, just preceding application and removal of NE respectively (see Fig. 3).

