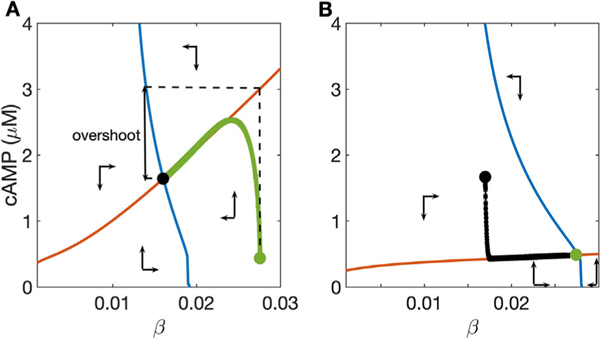
Fig. 3.
Phase plane for the two-variable reduced model: cAMP nullcline (red) and β nullcline (blue) divide state space into regions where cAMP concentration and active β1-AR concentration increase and decrease (see text). A: high dose, 100 nM NE; B: NE-free condition. Synaptic NE concentration changes the slope of the cAMP nullcline and the position of the β nullcline. Green and black circles are located at the steady states for the NE-free and high-dose NE conditions, respectively, and used as initial data for the alternate condition, producing the trajectories corresponding to the solutions shown in Fig. 2. Vertical arrow depicts the “overshoot,” in which the nearly vertical rise to the cAMP nullcline precedes a slower decay to the NE+ steady state. Note that cAMP concentration changes more rapidly than does the β concentration, leading to overshoot when the cAMP nullcline moves abruptly. The amplitude of the overshoot can be estimated by the height of the cAMP nullcline at the NE- steady state (i.e., vertical distance between green circle and red curve in A). The vertical difference between NE+ and NE− steady states (green and black circles) represents “dynamic range”, i.e. cellular responsiveness to ligand.

