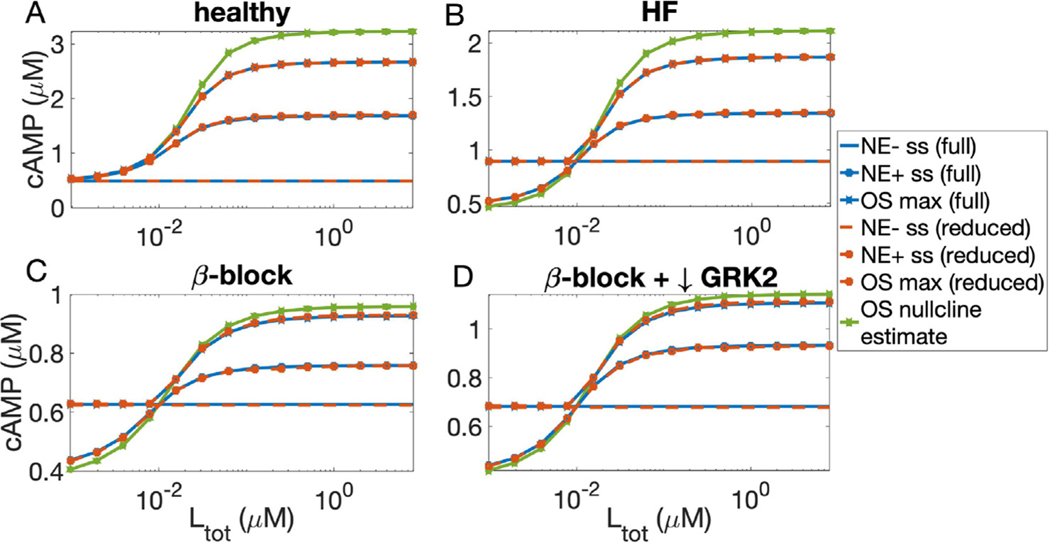
Fig. A.2.
Comparison between the predictions of the full and reduced model across a range of Ltot values in each scenario described in Fig. 5. A: cAMP steady states with 0 μM NE (NE- ss) and a nonzero NE concentration, and overshoot max (OS max) attained from an initial condition at the NE- ss, in the healthy condition (βtot = 0.028 μM, kGRK2 = 1.1e − 3 sec−1). B: as in A, but with NE- cAMP steady states computed using 0.01 μM NE and kGRK2 = 2.2e − 3 sec−1. C: as in B, with βtot = 0.014 μM. D: as in C, with kGRK2 = 1.1e − 3. In all panels, the overshoot max in the full and reduced model are computed from simulations (red and blue curves) and compared with the estimate of overshoot max (green) computed using the value of the cAMP nullcline corresponding to the β concentration at the NE- steady state. The nullclines consistently overestimate the overshoot.

