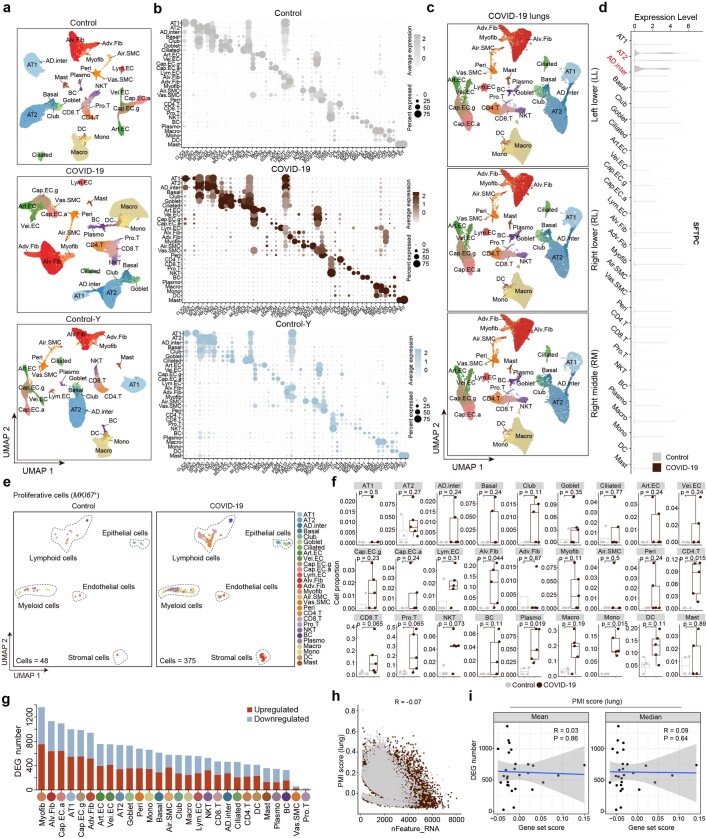
Extended Data Fig. 2. Data quality control and cell type identification by snRNA-seq.
(a) UMAP plots showing cell distributions of different cell types in Control, COVID-19, and Control-Y groups. (b) Dot plots showing the expression levels of cell type-specific marker genes in Control, COVID-19, and Control-Y groups. (c) UMAP plots showing cell distributions of different cell types in left lower (LL), right middle (RM), and right lower (RL) lobes of the lungs of patients with COVID-19. (d) Violin plot showing expression levels of SFTPC across different cell types in Control and COVID-19 lungs. (e) UMAP plots showing MKI67-positive proliferative cells in Control and COVID-19 groups. (f) Box plots showing cell proportions of proliferative cells across different cell types in human lung between Control and COVID-19 groups. Control, n = 4 lungs; COVID-19, n = 5 lungs with samples from three lung lobes each. Box shows the median (centre line) and the quartile range (25-75%) and the whiskers extend from the quartiles to the minimum and maximum values. (g) Bar plot showing numbers of DEGs (|logFC | > 0.5, adjusted P value < 0.05) in different cell types between COVID-19 and Control lungs. (h) Scatter plot showing gene set scores of PMI-related genes (lung) (Y-axis) and detected gene numbers (X-axis) across cells of Control and COVID-19 lungs. Control, n = 34,974 cells; COVID-19, n = 73,116 cells. R value from spearman’s correlation analysis is as indicated. (i) The dot plots showing the Spearman’s correlations between PMI scores and DEG numbers across different cell types of lung. Mean, the mean values of PMI scores across cells of each type. Median, the median values of PMI scores across cells of each cell types. R value from spearman’s correlation analysis is as indicated.

