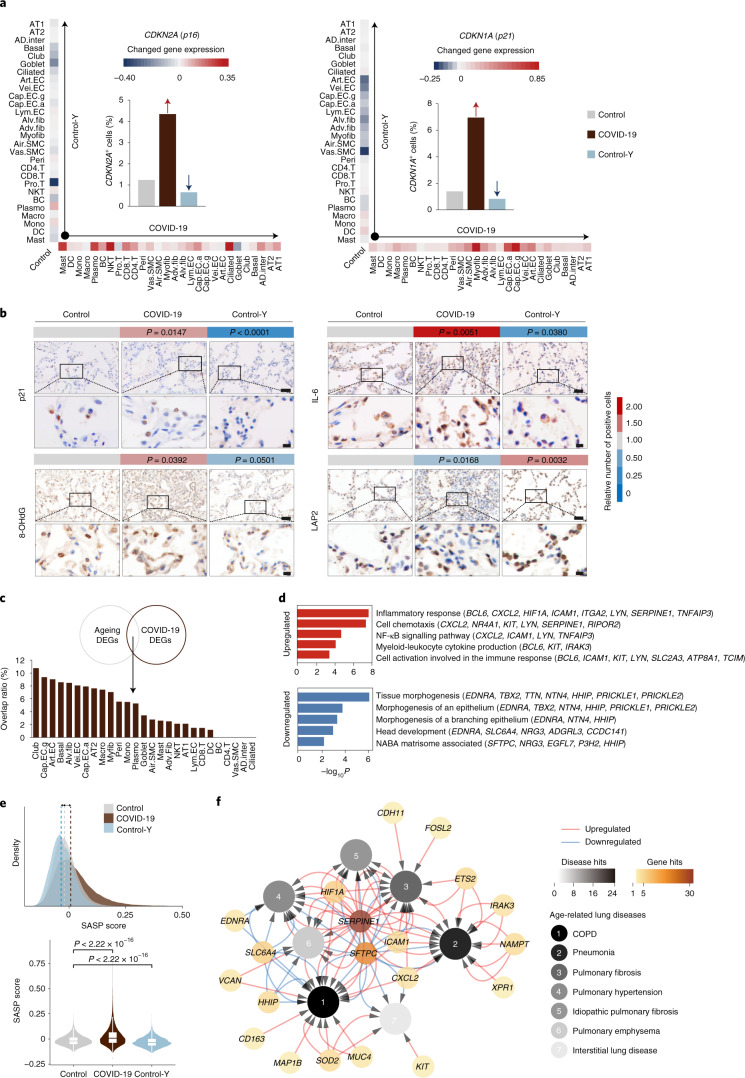
Fig. 4. Dissection of the relationships between ageing and COVID-19 DEGs in human lungs.
a, Hallmarks of senescence. Heatmaps (periphery, along the y and x axes) showing the relative expression levels of CDKN2A (left) and CDKN1A (right) in each cell type in the lungs of the COVID-19 and Control-Y groups compared with the Control group. The proportions of CDKN2A- (left) and CDKN1A-positive (right) cells in the lungs of the COVID-19 and Control-Y groups compared the Control group are shown (bar graphs). b, Immunohistochemical analysis of p21, IL-6, 8-OHdG and LAP2 in the indicated groups. Scale bars, 50 μm (main images; top) and 10 μm (magnified images; bottom). Quantitative data are shown as the mean. Control, n = 13 lungs; COVID-19, n = 5 lungs, with samples from three lung lobes each; and Control-Y, n = 4 lungs. One-tailed Student’s t-test P values are indicated. c, Genes shared by the ageing and COVID-19 DEGs. The proportion of DEGs shared by the ageing and COVID-19 groups are shown for the different cell types. d, GO term and pathway enrichment analyses for genes shared by the ageing and COVID-19 DEGs. e, Ridge map showing the density of distribution of the SASP scores of all of the cells in the Control, COVID-19 and Control-Y lungs (top). The medians of SASP scores of different groups are indicated with vertical lines. Violin and box-and-whisker plot showing the SASP scores of the Control (n = 34,974 cells), COVID-19 (n = 73,116 cells) and Control-Y (n = 33,062 cells) lungs. The boxes in the box-and-whisker plots show the median (centre line) and the quartile range (25–75%), and the whiskers extend from the quartile to the minimum and maximum values. P values, determined using a Wilcoxon signed-rank test, are indicated. f, Network plot showing the genes that altered concomitantly in Control and COVID-19 lungs and genes in the age-related lung disease database (https://www.disgenet.org/home/). The white-to-black legend on the left indicates the number of genes- from low to high, respectively-related to the indicated diseases; whereas the white-to-dark brown legend on the right indicates the number of cell types expressing the indicated genes from low to high, respectively. COPD, chronic obstructive pulmonary disease. Cell-type abbreviations as per Fig. 2a.

