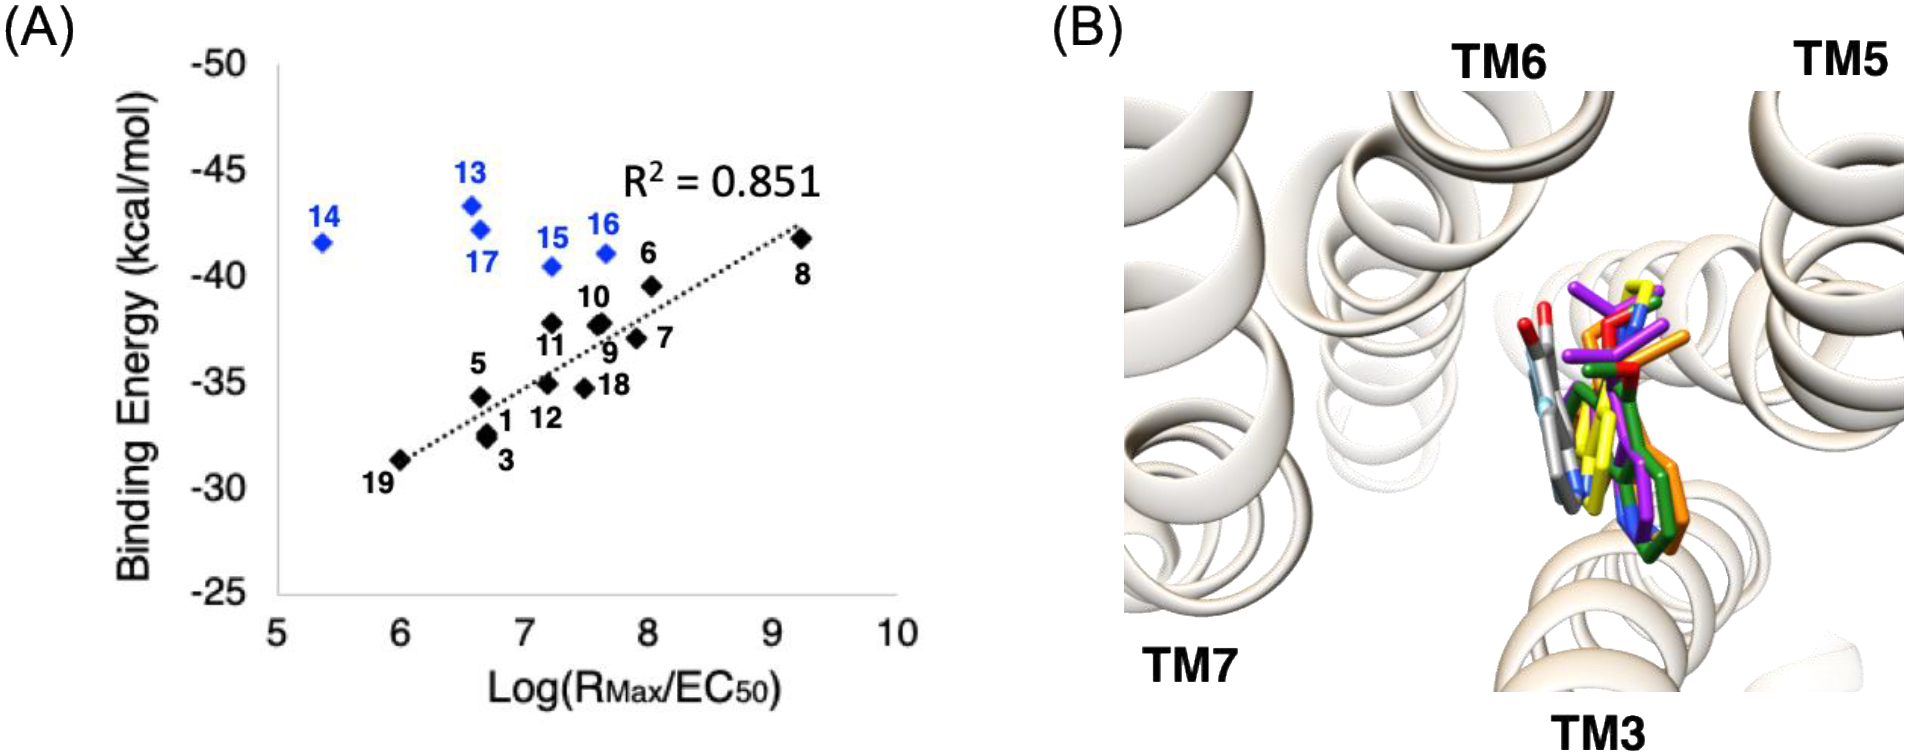
Figure 2.

(A) The correlation between the average binding energy from 20 ns of MD simulations (average of 3 runs) and the experimental signal transduction coefficients. The black dotted trend line is to 12 cases, which excludes 5 outliers (blue symbols, see text). This fit leads to an R2=0.851. (B) Four outliers [T5–14 (yellow), T5–15 (green), T5–16 (orange), and T5–17 (purple)] are much bulkier and more hydrophobic, causing them to rotate or translate significantly toward TM5 and away from TM6, compared to the other 12 ligands, with T5–8 (gray) and T5–1 (sky blue) are shown for comparison. This modified binding site for these bulky agonists may not be suitable for activating the GP, so that the predicted binding energy fails to correlate with activity.
