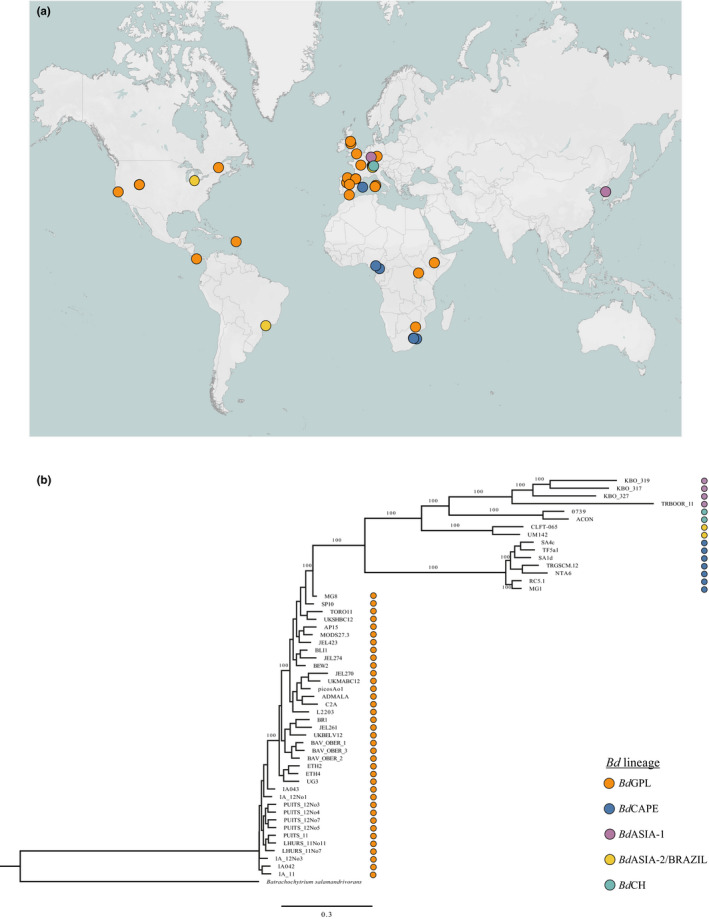
FIGURE 2.

(a) Map showing source locations of Bd isolates used for assay specificity testing; (b) phylogeny of isolates used for assay specificity testing, generated from WGS analysis. Lineage is indicated by dot colour. Map generated in Tableau and formatted in Adobe Illustrator
