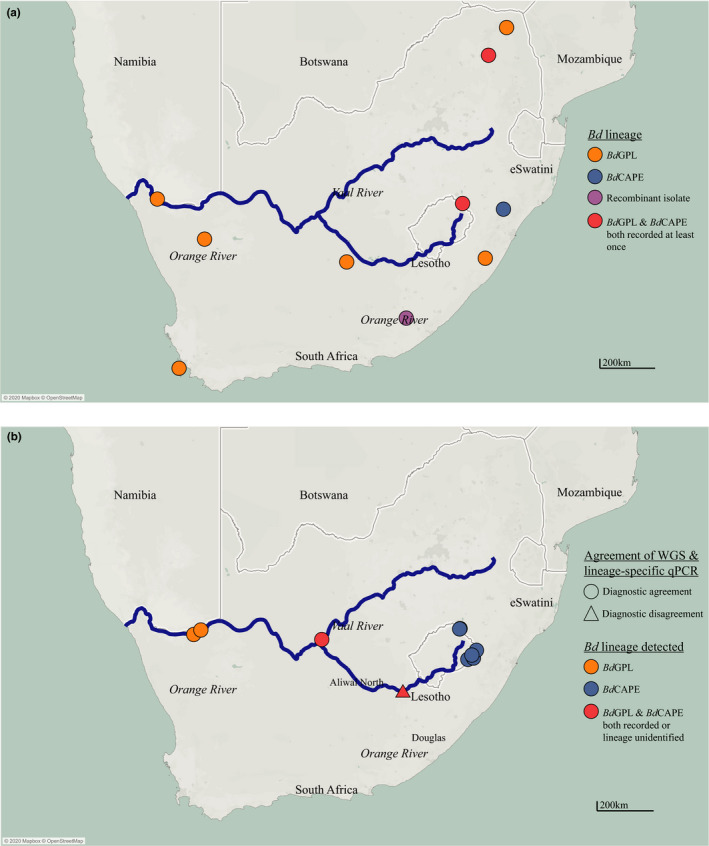
FIGURE 3.

Maps showing (a) Bd lineage locations in South Africa identified by isolation and WGS analysis and (b) comparison of Bd lineage typing of sites in South Africa using WGS analysis and lineage‐specific qPCR. Agreement of diagnostics is indicated by shape of the mark; lineages identified at the site are identified by the colour. Map generated in Tableau and formatted in Adobe Illustrator, additional data downloaded from naturalearthdata.com
