FIGURE 4.

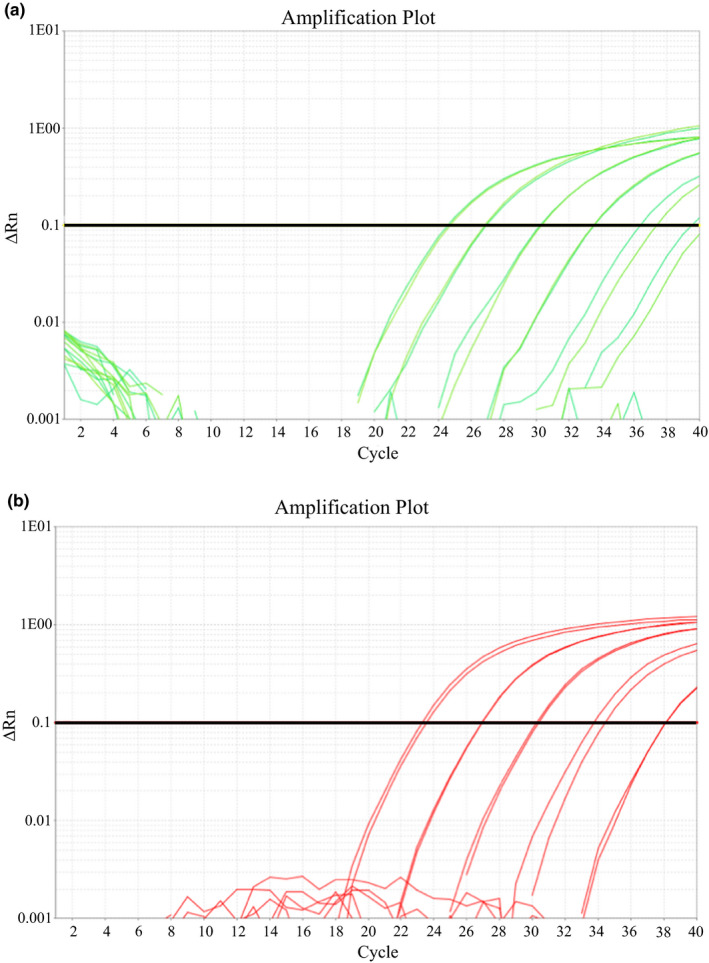
qPCR fluorescence amplification plots showing amplification of 10,000 GE, 1000 GE, 100 GE, 10 GE and 1 GE DNA quantitation standards with (a) BdCAPE‐specific primers and TaqMan MGB probe and (b) BdGPL‐specific primers and TaqMan MGB probe

qPCR fluorescence amplification plots showing amplification of 10,000 GE, 1000 GE, 100 GE, 10 GE and 1 GE DNA quantitation standards with (a) BdCAPE‐specific primers and TaqMan MGB probe and (b) BdGPL‐specific primers and TaqMan MGB probe