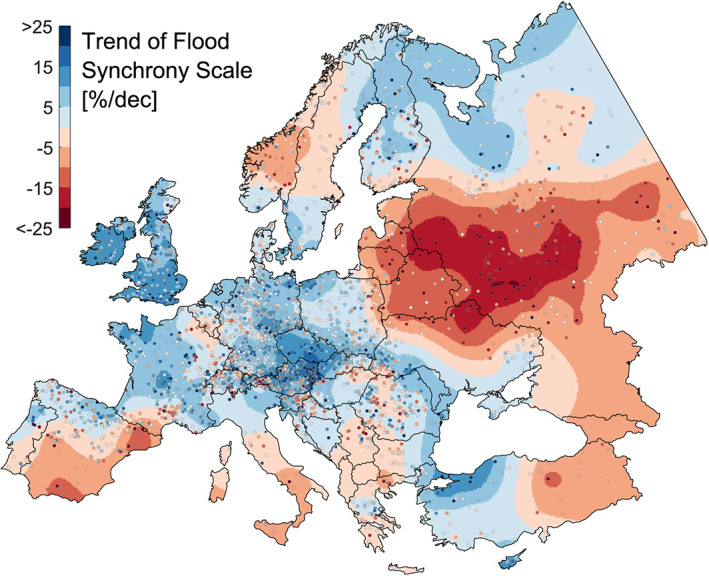
Figure 2.

Observed trends of flood extent in Europe, 1960–2010. Blue indicates increasing flood synchrony scales, and red denotes decreasing flood synchrony scales (in percent change of the mean scale per decade). The station‐based trends (shown as dots) are spatially interpolated to obtain the regional trends (background color).
