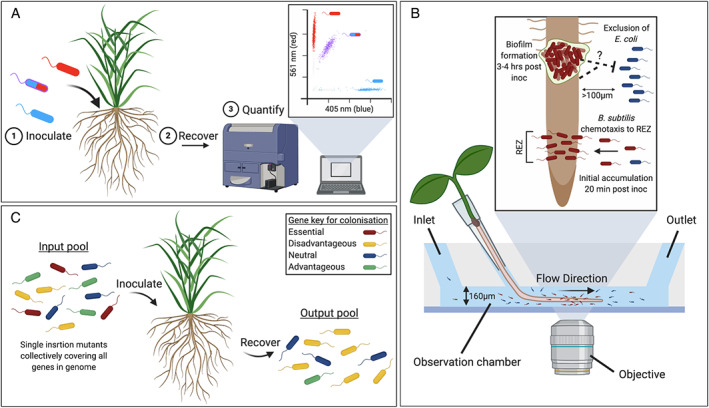
Fig. 2.

Tools to study bacterial root colonization. A. Flow cytometry: to track bacterial dynamics during colonisations bacterial species can be differentially marked with fluorescent proteins, e.g. red, blue or both, and quantified using flow cytometry. B. TRIS: a microfluidic device for real‐time visualization of bacterial–root interactions. The diagram shows a longitudinal section of a microfluidic channel containing root and bacterial cells (not drawn to scale). Seedlings are germinated through pipette tips into a channel to which bacteria can be introduced through the inlet. (Inset) a schematic of two bacteria, B. subtilis (red) and E. coli (blue) competing to attach to an A. thaliana root. TRIS showed that B. subtilis rapidly accumulates at the root elongation zone (REZ) within 20 min of bacterial inoculation, with subsequent aggregation occurring higher up the root (3–4 h post‐inoculation). Escherichia coli showed clear exclusion from the root, likely due to a diffusible element (represented by a dashed line) released by B. subtilis itself or the root when colonized by B. subtilis (Adapted from Massalha et al., 2017 ). C. Transposon mutagenesis screening: libraries containing single‐insertion transposon mutants that collectively cover all genes in the bacterial genome are inoculated onto a root system and recovered ‘X' days post‐inoculation. Comparison of input and output pools reveals whether a gene is essential (red), non‐essential (blue), advantageous (green) or disadvantages (yellow) for root colonization. Created with BioRender.com.
