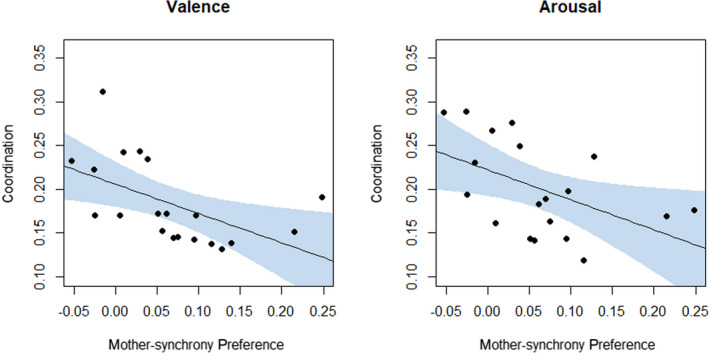
Figure 4.

Scatter plots showing negative correlations between mother–synchrony‐preference scores and affective coordination between mother and infant during naturalistic face‐to‐face interaction. Affective coordination is separately determined as coordination of (a) valence and (b) arousal, reflecting the maximum cross‐correlation coefficient from the respective time series analyses. Mother–synchrony‐preference is expressed as a proportion difference score, reflecting looking time preference to synchronous over asynchronous visual‐tactile stimulation as a proportion of total looking time to the mother. Shaded area represents 95% confidence interval of regression estimate. [Color figure can be viewed at wileyonlinelibrary.com]
