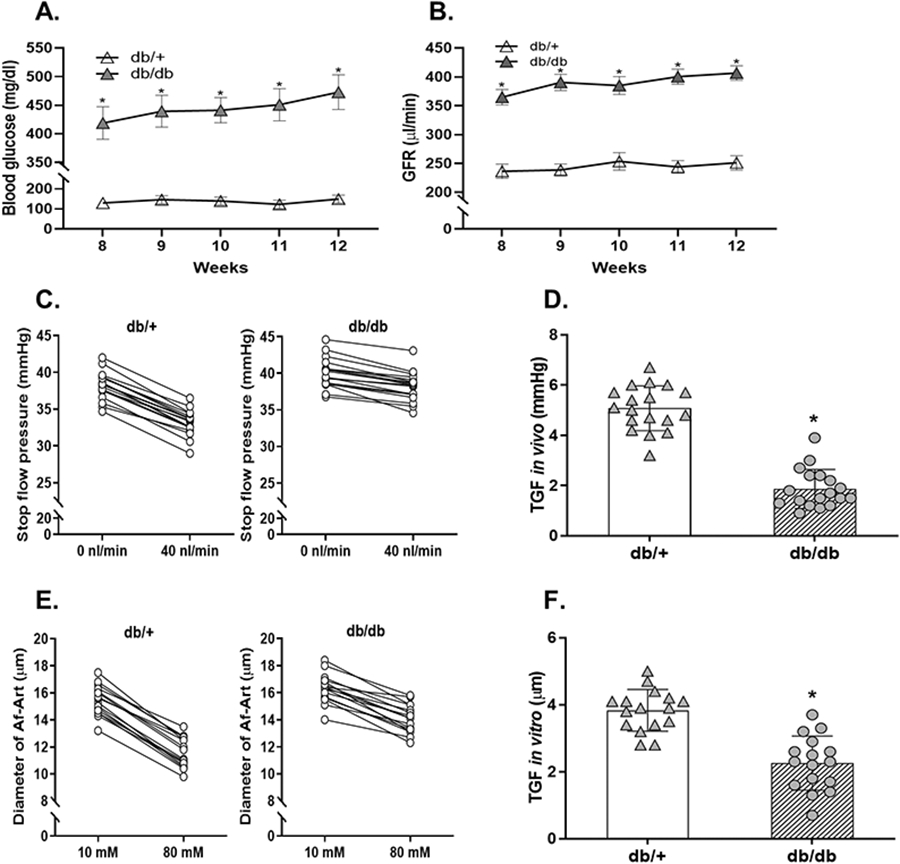
Figure 1. Blood glucose, GFR and TGF responsiveness in db/db mice.

(A) The blood glucose concentration in db/db and db/+ mice. n=12; *P<0.01 vs db/+. (B) The GFR in db/db and db/+ mice. n=10; *P<0.01 vs db/+. (C and D) The TGF response in vivo in db/db and db/+ mice. n=18 tubules/6 mice per group; *P<0.01 vs db/+. (E and F) The TGF response in vitro in Akita and WT mice. n=16 nephrons/group; *P<0.01 vs db/+, *P<0.01 vs db/+. Statistical difference in (A and B) was calculated by two-way repeated measures ANOVA followed by Sidak multiple comparisons test. Statistical difference in (C-F) was calculated by t-test.
