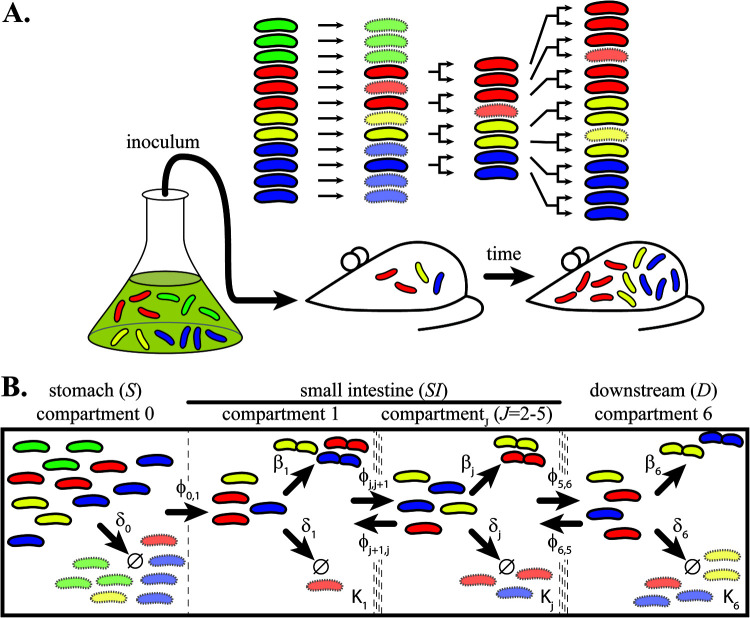
FIG 1.
Monitoring tagged bacterial populations in experiments and models. (A) Schematic representation of the experimental setup. Bacteria are labeled with heritable genetic tags (exemplified by red, green, yellow, and blue color). Mice are inoculated from a starting population grown in vitro. After infection, random death events (transparent bacteria) reduce the population size and tag diversity (e.g., disappearance of the green bacteria). Colonizing bacteria can then replicate, and if they grow without competition, tag frequencies do not change. If bacteria die, the tag frequencies change. The difference between replication rate and death rate determines the net growth rate, i.e., the change in population size over time. (B) Illustration of the population dynamical model. The GI tract is split into six compartments (separated by dotted lines), starting with the stomach (S, compartment 0), five compartments in the small intestine (SI, compartments 1 to 5), and a final composite downstream compartment accounting for all downstream sections, like the cecum, large intestine, and secreted bacteria (D, compartment 6). Arrows indicate processes that affect the population dynamics. Each compartment has a carrying capacity (K), death rate (δ), replication rate (β), and forward and retrograde migration rate (φ), except for the stomach, where we only consider death and forward migration rate. Bacteria with a central constriction indicate replication; bacterial death is indicated by Ø.

