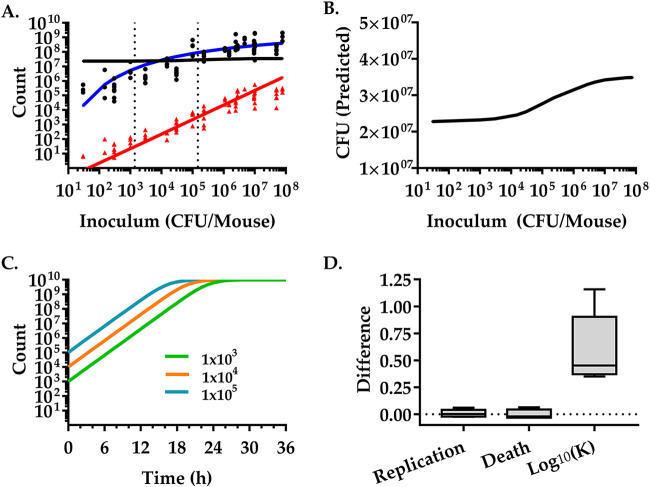
FIG 6.
Inoculum size strongly influences pathogen burden. Mice were infected with different inocula of V. cholerae and sacrificed at 24 h to isolate bacteria. (A) The V. cholerae CFU number (black dots) and NB (red triangles) were determined in the small intestine. Each data point represents one mouse (93 total). CFU (black line) and NB (red line) were predicted by a mathematical model fitted to experimental data of mice infected with an intermediate inoculum of 1.48 × 10⁵ CFU V. cholerae per mouse (see Fig. 2). The blue curve shows the bacterial burden calculated by a Hill function of the inoculum size, N(t) = K × N(0)ert/[K+N(0)(ert − 1)] and K = a × N(0)/[b+N(0)] and was fitted to the logarithm of the experimental data using the Levenberg-Marquardt algorithm. The resulting values for the coefficients and the 95% confidence intervals are a = 9.244 (8.312, 10.18) and b = 1.227 (0.7051, 1.75) (adjusted R2 = 0.8613). Dotted vertical lines represent model-fitted doses of 1.37 × 10³ and 1.48 × 10⁵ CFU. (B) Zoom-in of the predicted CFU numbers. The same data as the black line in panel A but on an enlarged, linear y axis to show the nonlinear relationship between the inoculum size and the bacterial load at 24 h more clearly. (C) Schematic representation of logistic growth and the dependence of the bacterial load modeled at a given time on the inoculum (105, cyan; 104, orange; 103, green). (D) Differences between individual parameters (replication rates, death rates, and the log10 of the carrying capacity) derived from our model fit of the high-inoculum experiments (Fig. 2) to the parameters derived from the low inoculum experiment fits (Fig. S3). The dotted line is set to zero for reference.

