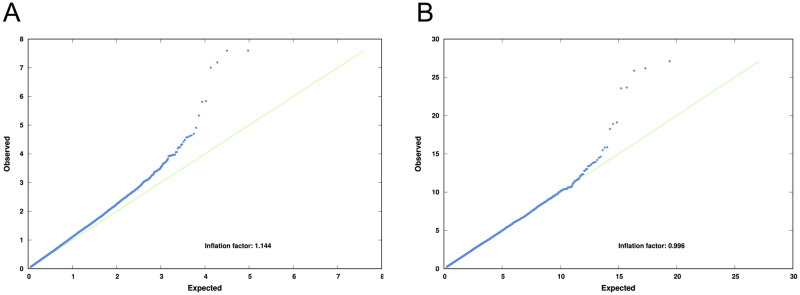
Fig 2. Quantile-quantile plots of Chi-Squared values before (A) and after (B) correction by EMMAX.
The blue dots are the SNPs. On the Y axis, the observed Chi-Square value for each SNP, on the X axis is the expected value for each SNP. The green line represents when both expected and observed values coincide (inflation factor = 1).

