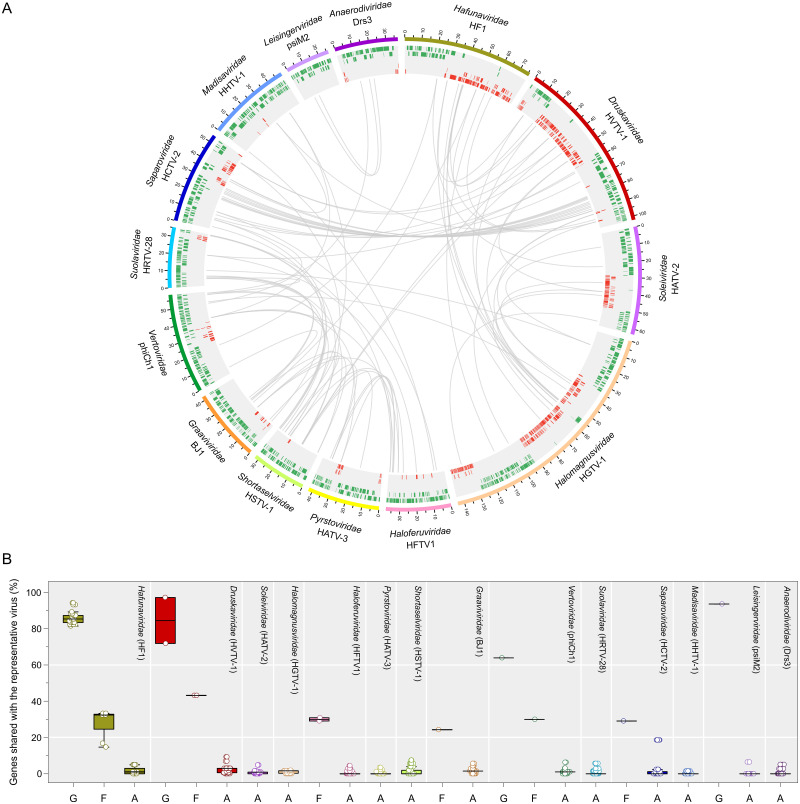
Fig 3. Overview of homologous proteins shared by arTVs.
(A) The circus plot displays gene content similarity between representative members of each proposed family. Viral genomes from different families are indicated with distinct colors. The genomic coordinates (kbp) are indicated on genome maps. Putative ORFs distributed on 5 tracks (to avoid overlapping) are represented by green and red tiles on the forward and reverse strands, respectively. Homologous proteins are linked by gray lines. The representative viruses and the proposed virus family names are indicated. (B) The box plot shows the percentage of genes shared by a representative virus from each family with other members of the same genus (G) and family (F) as well as with arTVs from other families (A). Each box represents the middle 50th percentile of the data set and is derived using the lower and upper quartile values. The median value is displayed by a horizontal line. Whiskers represent the maximum and minimum values with the range of 1.5 IQR. Each virus is represented by a dot. In the circus and box plots analyses, proteins with over 30% amino acid sequence identity and E-value < 1 × 10⁻²⁵ in our arTV database are considered to be homologous. Data underlying this figure can be found in S2 Data. arTV, archaeal tailed virus.

