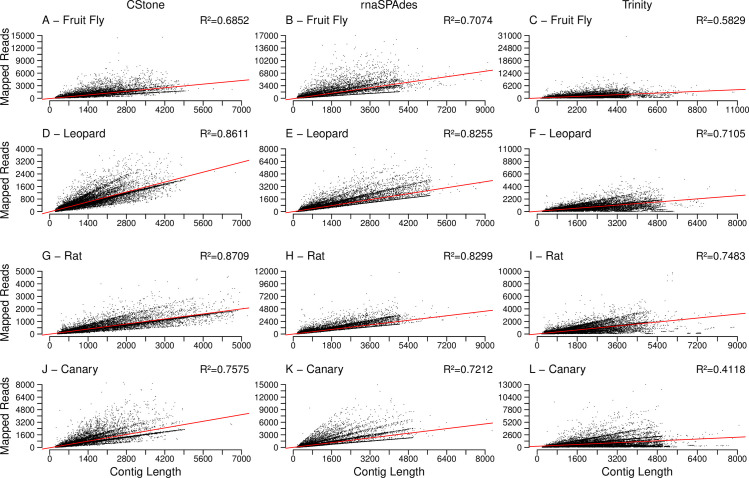
Fig 5. Lengths of contigs versus the number of reads mapping to them.
The assembler used is indicated along the top of the figure, while the x-axis is labeled along the bottom. The red line indicates the line of best fit based on a linear model. R2 values, located on the top right corners, indicate the correlation between mapped read counts and contig lengths, p-values of which are discussed in the text.

