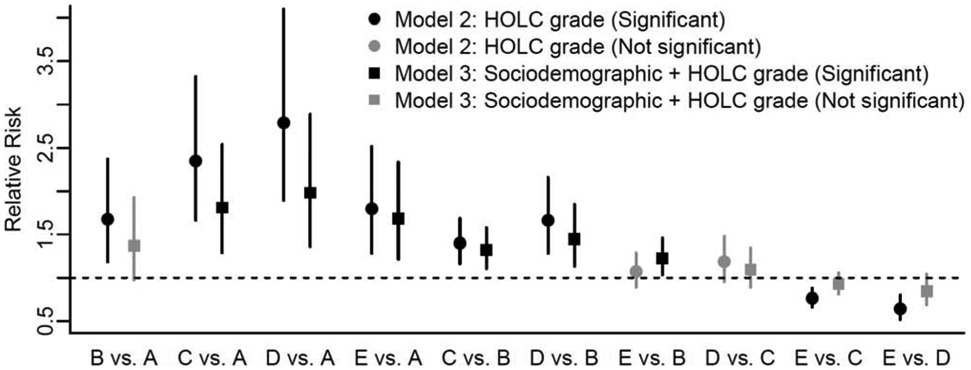
Figure 3:

Relative risk comparisons of the density of tobacco retailers in each subregion, among all pairs of HOLC grades.
The circles denote the relative risks for a model that only contains a possible city effect and HOLC grade effect (Model 2) and the squares denote the relative risk for a model that also contains sociodemographic factors (Model 3). Note that Model 1 did not assess HOLC grades and cannot therefore be included.
Black font indicates statistically-significant differences between pairs; gray font indicates no difference. Unlike Table 2, significance tests adjust for multiple comparisons. The vertical lines denote simultaneous 95% CIs for the relative risk, accounting for spatial dependence across the subregions. The HOLC grades are A: “Best”, B: “Still Desirable”, C: “Declining”, and D: “Hazardous”. Subregions not graded by the HOLC are denoted E.
