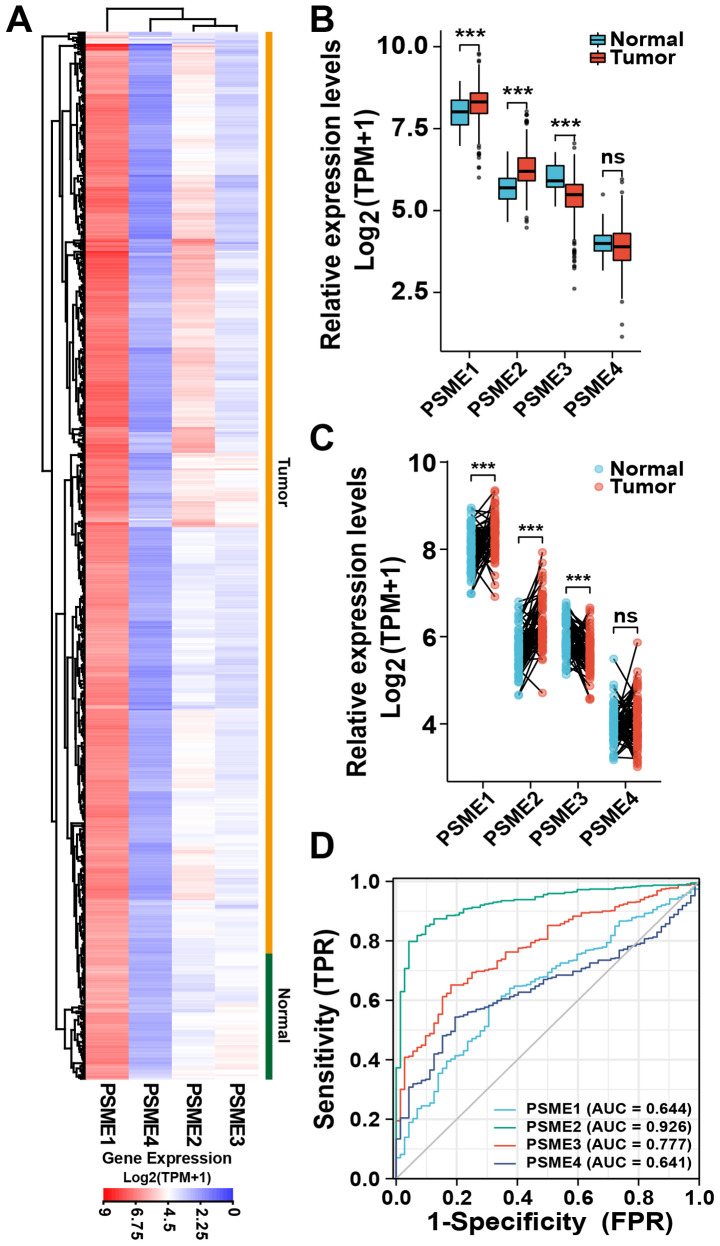
Figure 1.
Expression profiles of four PSME genes in KIRC (n=533; yellow) and normal tissues (n=72; green) samples from TCGA database. (A) Heatmap showing differential expression of the four PSME genes between the KIRC and in the normal. Red represents high expression, and blue indicates low expression. (B) Boxplots illustrating differential expression of the four PSME genes between normal and tumor tissues. (C) Expression of the four genes in normal adjacent and tumor tissues from patients with kidney cancer. The data were analyzed using paired t-tests. (D) Receiver operating characteristic curve analysis to assess the validity of the expression level from the four PSME genes in KIRC versus normal tissues. ***P<0.001. AUC, area under the ROC curve; TPR, true positive rate; FPR, false positive rate. PSME2, proteasome activator complex subunit 2; KIRC, kidney renal clear cell carcinoma.

