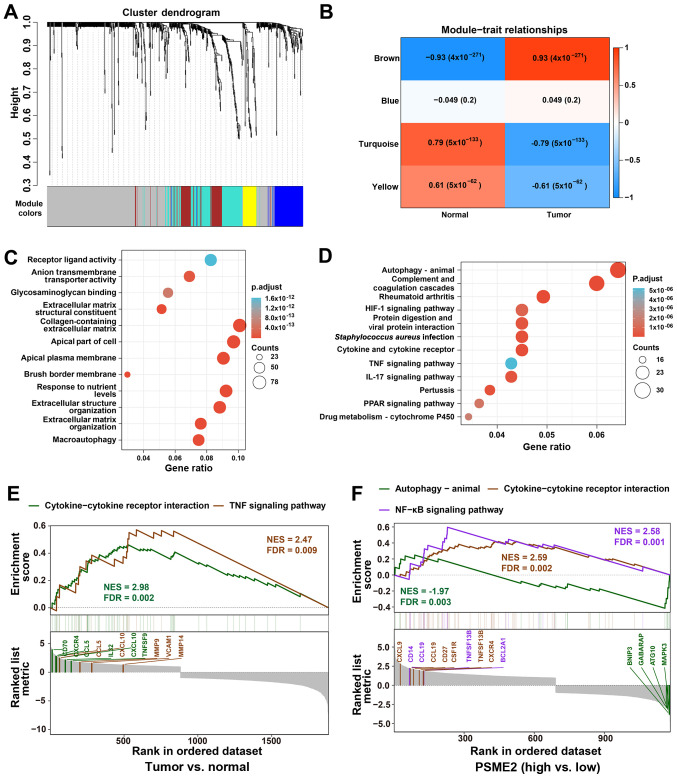
Figure 3.
Functional characterization of PSME2 in ccRCC using WGCNA and GSEA. (A) WGCNA hierarchical cluster dendrogram of the top 25% genes ranked by SD from large to small ccRCC. Each branch in the tree represents one gene. Each color represents one co-expression module. (B) PCC matrix of the correlation between MEs and clinicopathological status (normal and tumor) of ccRCC. Each row corresponds to a colored ME detected using WGCNA, and each column corresponds to a trait. The values of PCC ranged from -1 to 1 depending on the strength of the relationship. A positive value means that the probe sets in a specific co-expression module increase as the variable increases, while a negative value indicates a specific co-expression module decreases as the variable decreases. Each PCC value has the corresponding P-value in brackets. (C) GO enrichment analysis using The Database for Annotation, Visualization and Integrated Discovery. The horizontal axis represents the proportion of PSME2 enriched in each GO term. The vertical axis represents the annotation terms. The size of the bubble represents the number of genes in each GO term; depth of each circle color represents P-value. (D) KEGG enrichment for the differentially expressed genes in Fig. 3B. (E) GSEA revealing cytokine-cytokine receptor interaction and TNF signaling pathway associations between tumor and normal samples from TCGA. (F) GSEA revealing autophagy-animal, cytokine-cytokine receptor interaction and NF-κB signaling pathway associated with PSME2 expression levels from TCGA database. ME, module eigengenes; GO, Gene Ontology; KEGG, Kyoto Encyclopedia of Genes and Genomes; WGCNA, weighted gene co-expression network analysis; GSEA, Gene Set Enrichment Analysis; TCGA, The Cancer Genome Atlas; PSME2, proteasome activator complex subunit 2; ccRCC, clear cell renal cell carcinoma; NES, normalized enrichment score; FDR, false discovery rate; PCC, Pearson's correlation coefficient.

