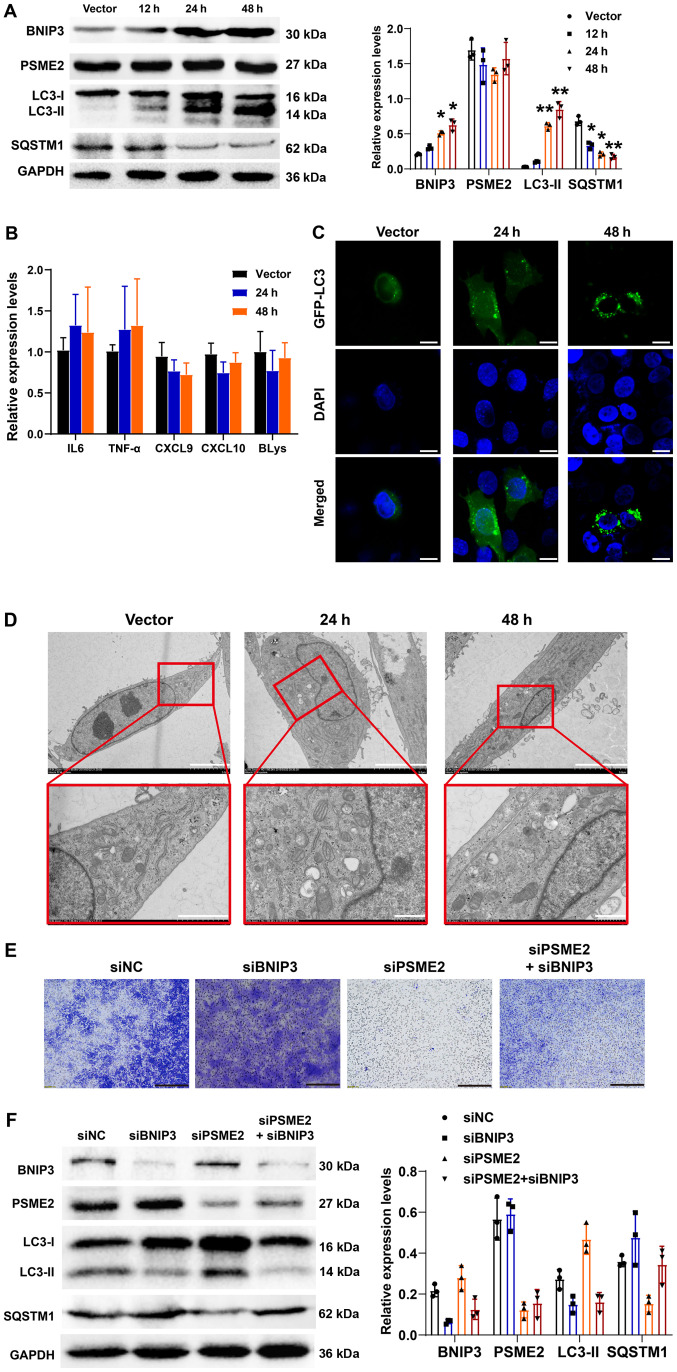
Figure 7.
Effects of BNIP3 overexpression on autophagy and tumor cytokine expression level with or without siPSME2 in the CAKI-1 cell line. (A) Western blot analysis of autophagy-related proteins and PSME2 in empty vector and BNIP3-overexpressing cells at 12, 24 and 48 h following transfection, and the results were quantified using densitometry. *P<0.05, **P<0.01, compared to vector. (B) IL-6, TNF-α, CXCL9, CXCL10 and BLys mRNA expression levels were measured using reverse transcription-quantitative PCR. The cells were transfected with either empty plasmid or BNIP-3 overexpression vector for 24 and 48 h. (C) Subcellular localizations of LC3 were determined using confocal microscopy. Scale bar, 10 µm. (D) Transmission electron microscope of the CAKI-1 cell line transfected with empty plasmid or BNIP-3 overexpression vector for 24 and 48 h. Top scale bar, 5 µm; bottom scale bar, 1 µm. (E) Invasion of the CAKI-1 cell line simultaneously transfected with siBNIP3 and siPSME2 using a Transwell invasion assay. Scale bar, 200 µm. (F) A total of five protein biomarkers were found to be differentially expressed in BNIP3 or/and PSME2 knockout cells and the results were quantified using densitometry. PSME2, proteasome activator complex subunit 2; si, small inhibiting; NC, negative control; SQSTM1, sequestersome 1; BNIP3, BCL2 interacting protein; CXCL, C-X-C motif chemokine ligand; BLys, B lymphocyte stimulator.

