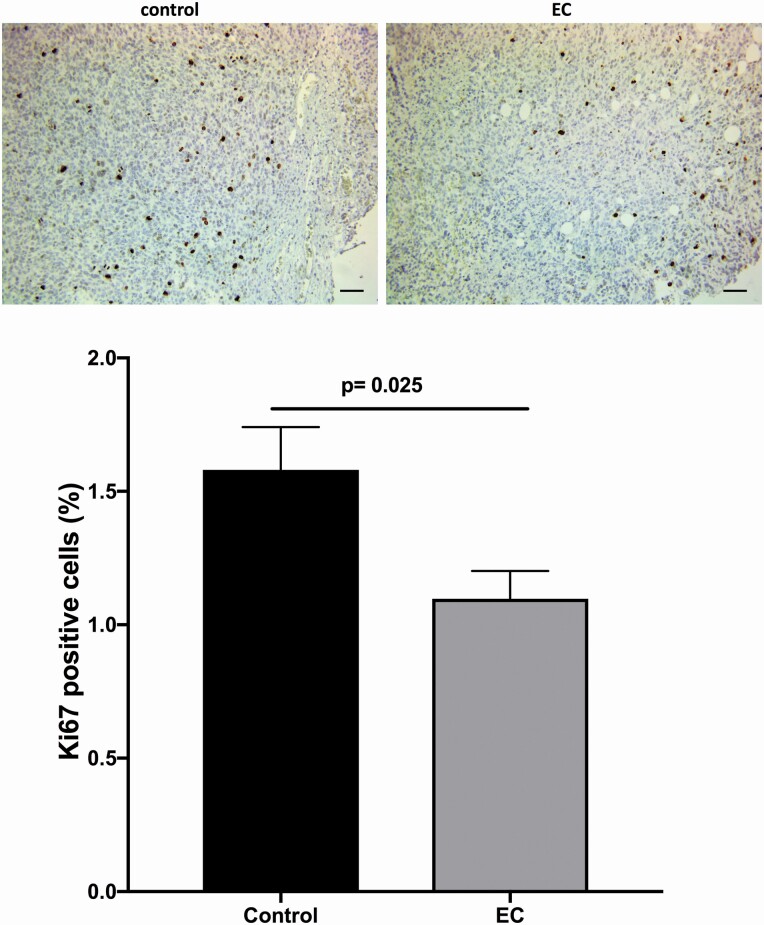
Figure 5.
Representative images of (−)-EC (3 mg/kg/day/15 days) induced effects on the number of cells expressing nuclei positive to Ki67. A significant reduction in the number of Ki67-positive (graph) cells as compared with the control group (P = 0.025). Bar = 50 µm. The data were analysed by t-test. Each bar represents the means ± SEM with n = 10.

