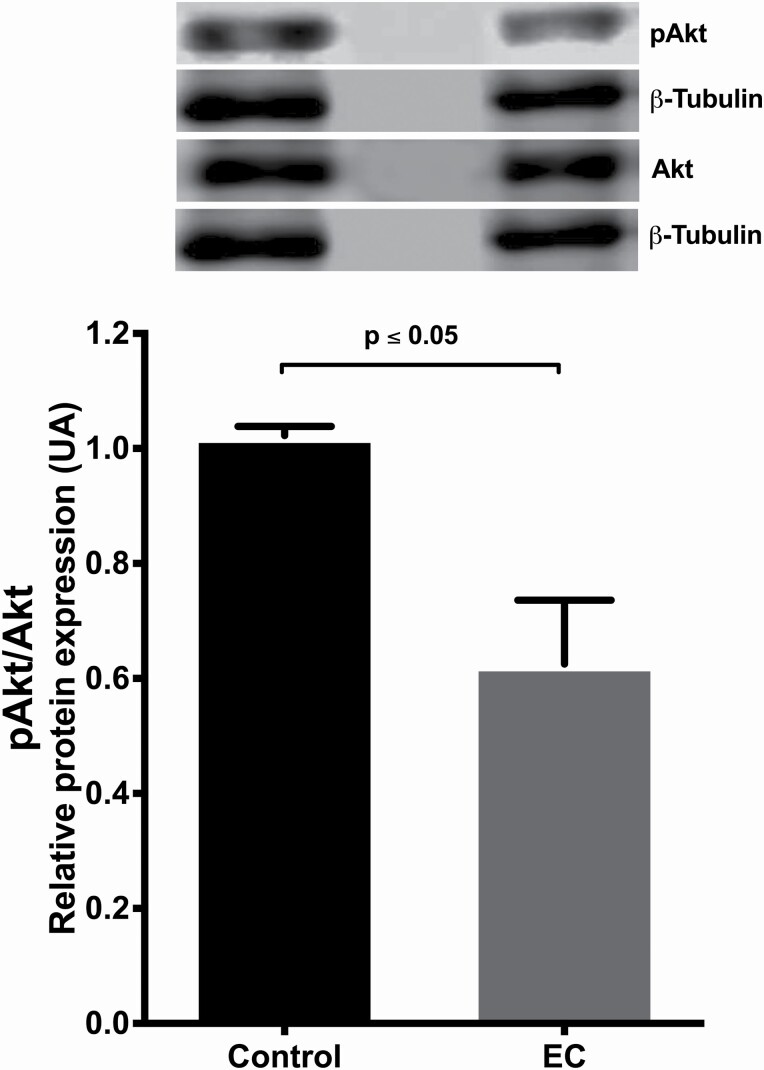
Figure 7.
Representative western blot of (−)-EC (3 mg/kg/day/15 days) induced effects on activation (phosphorylation) of AKT. The phosphorylated Akt/β-tubulin quotient on Akt/β-tubulin is presented, showing a decrease in activation in relation to control P = 0.003. The densitometric intensity of each band was measured using ImageStudio, dividing the value by the corresponding β-tubulin densitometric intensity and these values were divided (phosphorylated/total forms). The results were expressed as the optical density of the reading of the pAkt/β-tubulin/Akt/β-tubulin ratios. The data were analysed by t-test. Each bar represents the means ± SEM. P values ≤ 0.05 were considered statistically significant (n = 10).

