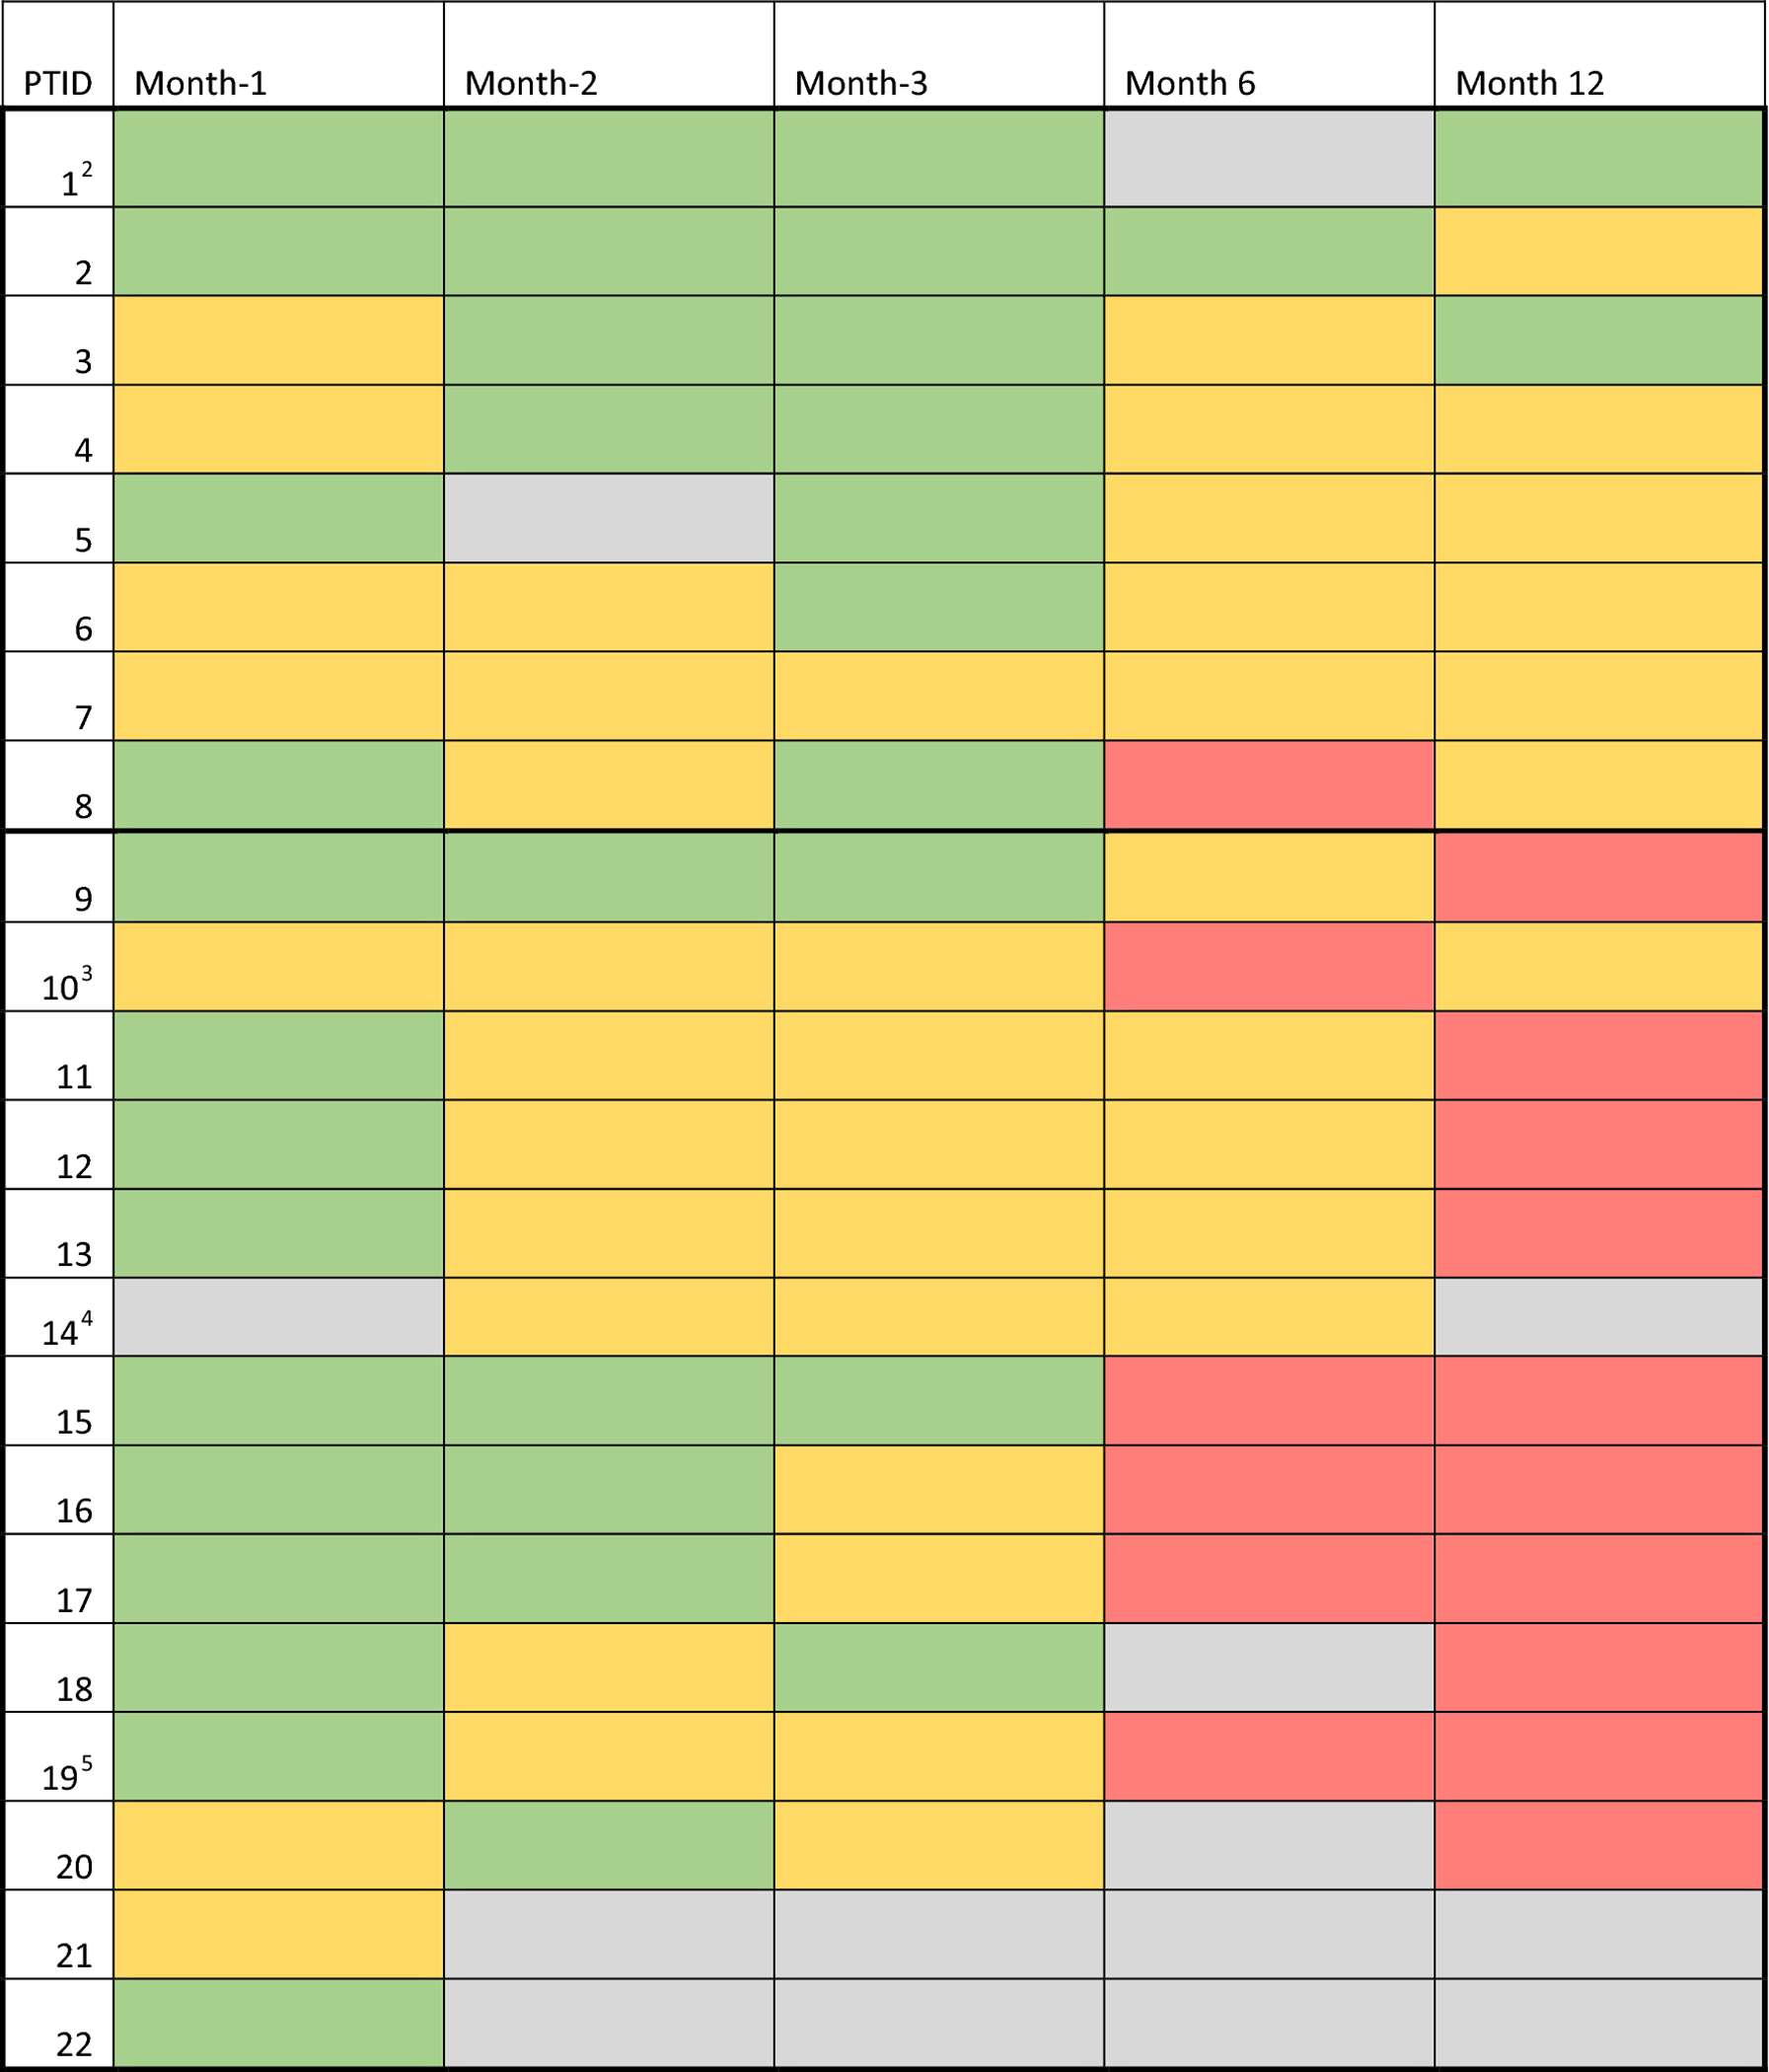
Figure 2.

Adherence heat map of the 3P qualitative participants over the 12 months 3P study (n = 22). First box (1–8) represents persistors, second box (9–22) represents non-persistors. Intracelllular TFV-DP levels from DBS as a biomarker of PrEP adherence in the past month were collected at months 1, 2, 3, 6 and 12 (top row) for each participant. Adherence levels are depicted in Green (high adherence: ≥ 500 fmol/punch at M1 and ≥ 700 fmol/punch at any later time point), Yellow (medium adherence: 16.6–499 fmol/punch at M1 and 16.6–699 fmol/punch at any later time point) and Red (low adherence: < 16.6fmol/punch at any time point, which indicates no evidence of product use in the past month, 11). Missed visits or those who refused DBS, are depicted in grey (Color figure online)
