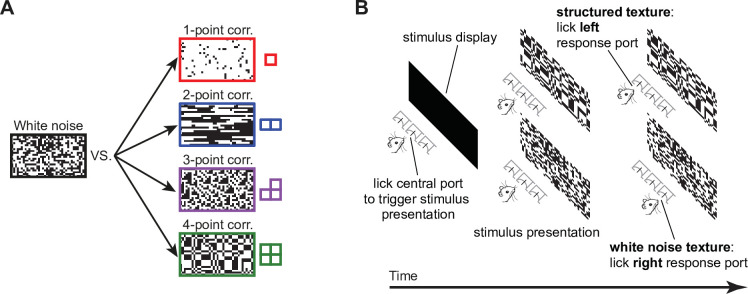
Figure 1. Visual stimuli and behavioral task.
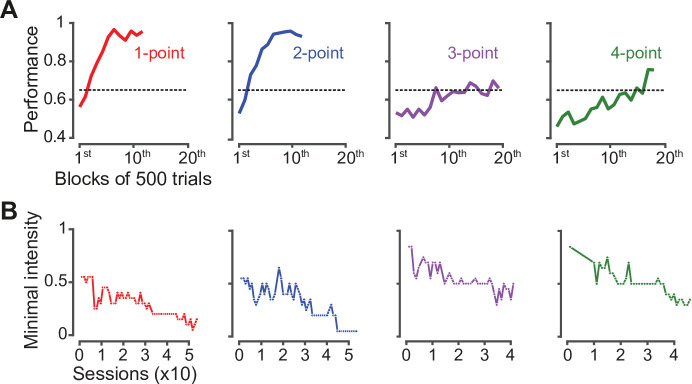
(A) Schematic of the four kinds of texture discrimination tasks administered to the four groups of rats in our study. Each group had to discriminate unstructured binary textures containing white noise (example on the left) from structured binary textures containing specific types of local multipoint correlations among nearby pixels (i.e. 1-, 2-, 3-, or 4-point correlations; examples on the right). The textures were constructed to be as random as possible (maximum entropy), under the constraint that the strength of a given type of correlation matched a desired level. The strength of a correlation pattern was quantified by the value (intensity) of a corresponding statistic (see main text), which could range from 0 (white noise) to 1 (maximum possible amount of correlation). The examples shown here correspond to intensities of 0.85 (one- and two-point statistics) and 0.95 (three- and four-point statistics). (B) Schematic representation of a behavioral trial. Left and center: animals initiated the presentation of a stimulus by licking the central response port placed in front of them. This prompted the presentation of either a structured (top) or an unstructured (bottom) texture. Right: in order to receive the reward, animals had to lick either the left or right response port to report whether the stimulus contained the statistic (top) or the noise (bottom). Figure 1—figure supplement 1 shows the performances attained by four example rats (one per group) during the initial phase of the training (when the animals were required to discriminate the stimuli shown in A), as well as the progressively lower statistic intensity levels that these rats progressively learned to discriminate from white noise during the second phase of the experiment.


