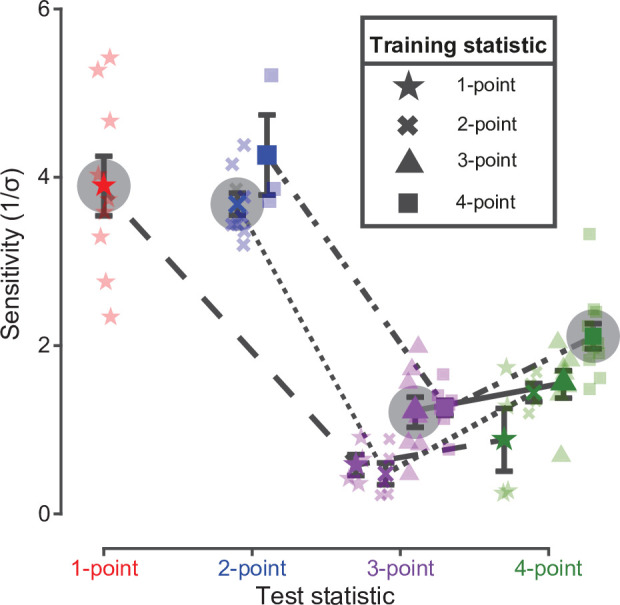
Figure 4. Rat sensitivity to multipoint correlations – dependence on training history and within-subject analysis.

Colored points with halo show the average sensitivities (with SEM) of the four groups of rats to the statistics (indicated by the symbols in the key) they were originally trained on (i.e. same data as the colored diamonds in Figure 2C). The other colored symbols connected by a line show the average sensitivities (with SEM) obtained when subgroups of rats originally trained on a given statistic (as indicated by the symbol in the key) were tested with different statistics (as indicated in abscissa). Specifically: (1) out of the nine rats originally trained/tested with one-point correlations (star), four were tested with three-point (purple star) and four with four-point (green star) correlations (one rat did not reach this test phase); (2) out of the nine rats originally trained/tested with two-point correlations (cross), five were tested with three-point (purple cross) and four with four-point (green cross) correlations; (3) out of the eight rats originally trained/tested with three-point correlations (triangle), seven were tested with four-point (green triangle) correlations (one rat did not reach this test phase); and (4) out of the eleven rats originally trained/tested with four-point correlations (square), eight were tested with three-point (purple square) and three with two-point correlations (blue square). Sensitivities achieved by individual animals are represented as shaded data points with the corresponding symbol/color combination.
