. 2021 Nov 17;10:e71252. doi: 10.7554/eLife.71252

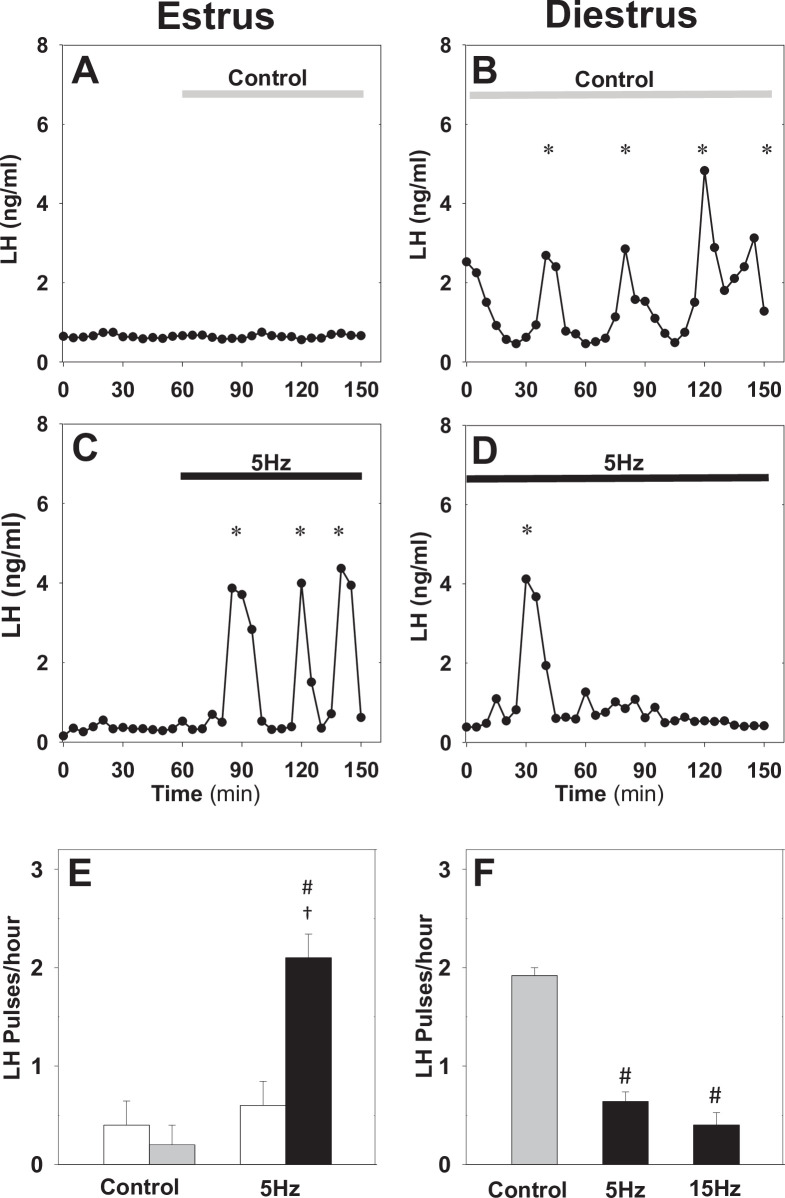
Figure 2. Differential effect of optic stimulation of ARC kisspeptin neurons in estrous and diestrous Kiss-Cre mice.

(A–B) Representative examples showing LH secretion in response to no stimulation (grey bar) or sustained blue light (473 nm, 5 ms pulse width, black bar) activation of kisspeptin neurons at 5 Hz in estrous (C) and diestrous (D) mice. (E) Summary showing mean ± SEM LH pulse frequency over the 60 min control period (white bars) and over the subsequent stimulation period (black bar) in estrous mice. (F) Summary showing mean ± SEM LH pulse frequency in the control (grey bar) and stimulated (black bars) diestrous mice. *Denote LH pulses. #p < 0.05 vs control; p < 0.05 vs pre-stimulation; n = 5–6 per group.

Figure 2.

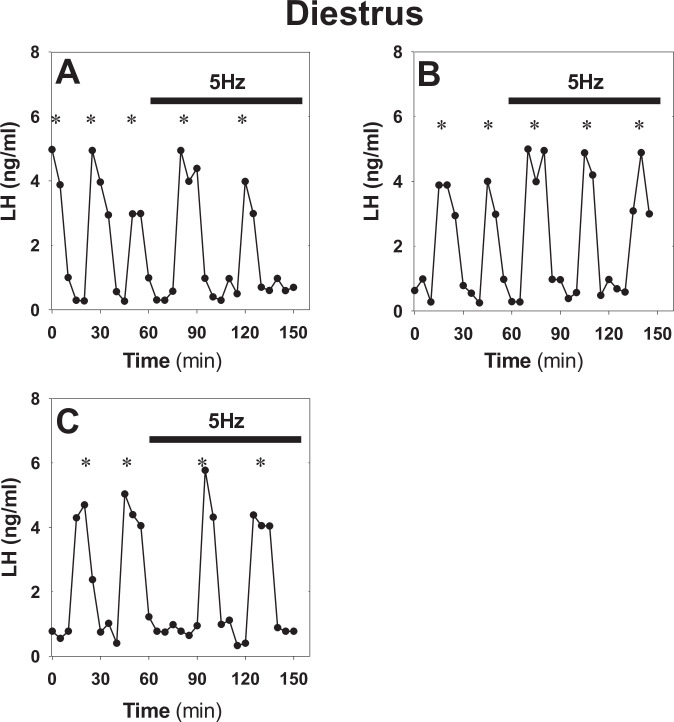
Figure 2—figure supplement 1. Optogenetic stimulation of ARC kisspeptin neurons in diestrous Kiss-Cre mice using the original protocol.

Figure 2—figure supplement 1.

(A–C) Representative examples showing LH secretion in diestrous Kiss-Cre mice over a 60 min control period followed by a 90 min period of sustained blue light (473 nm, 5 ms pulse width, black bar) activation of kisspeptin neurons at 5 Hz. There is a tendency for LH pulses to slow down during the activation period: (A) 0.05 vs 0.222 pulses/h (slow down); (B), 0.03 vs 0.03 pulses/h (no change); and (C) 0.03 vs 0.222 pulse/h (slow down). To investigate the possibility of an effect in more depth, we revised the protocol by removing the control period and extending stimulating to 150 min (see Figure 1 in main text). *Denote LH pulses.
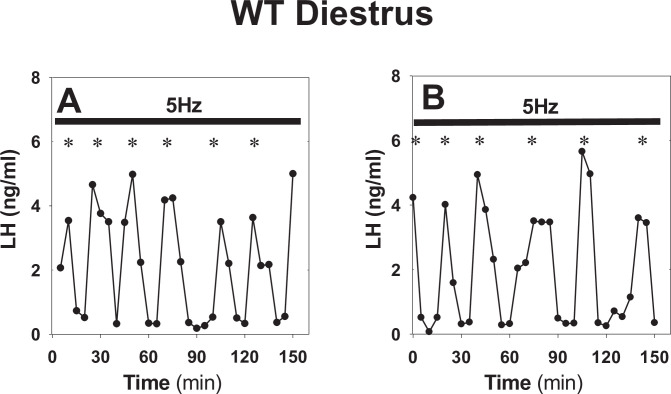
Figure 2—figure supplement 2. Sustained optogenetic stimulation in control WT animals.

Figure 2—figure supplement 2.

(A–B) Representative examples showing normal LH secretion in diestrous WT animals under sustained blue light (473 nm, 5 ms pulse width, black bar) activation of kisspeptin neurons at 5 Hz. *Denote LH pulses.