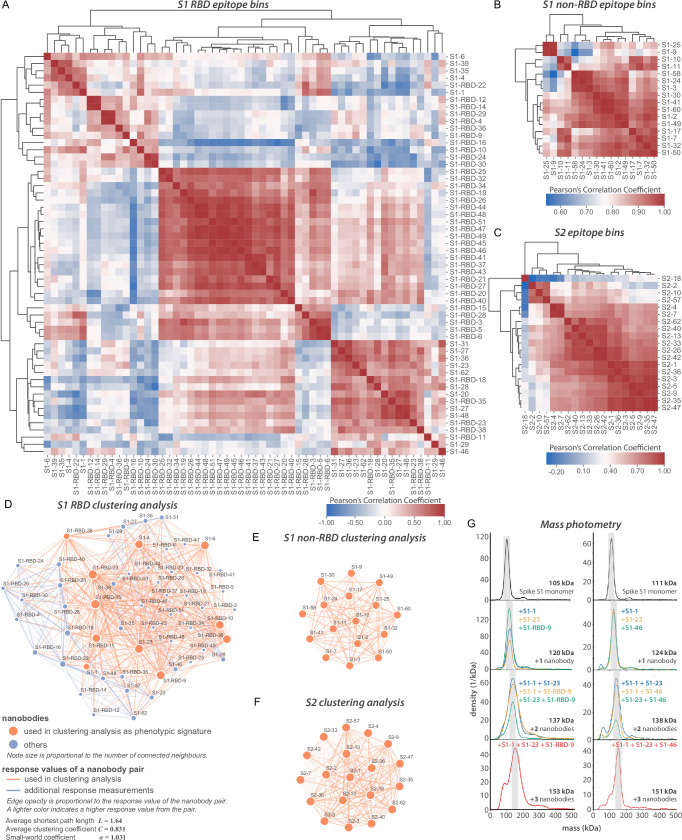
Figure 3. Epitope characterization of nanobodies against SARS-CoV-2 spike.
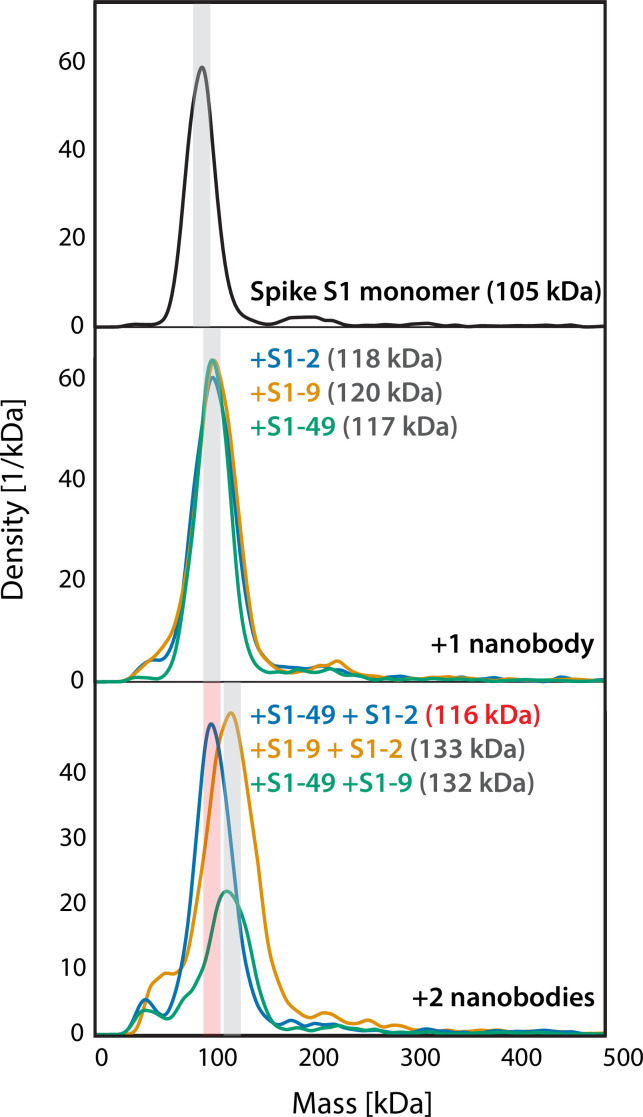
(A) Major epitope bins are revealed by a clustered heat map of Pearson’s correlation coefficients computed from the response values of nanobodies binding to the spike RBD in pairwise cross-competition assays on a biolayer interferometer. Correlated values (red) indicate that the two nanobodies respond similarly when measured against a panel of 11 RBD nanobodies that bind to distinct regions of the RBD. A strong correlation score indicates binding to a similar/overlapping region on the RBD. Anticorrelated values (blue) indicate that a nanobody pair responds divergently when measured against nanobodies in the representative panel and indicate binding to distinct or non-overlapping regions on the RBD. (B) As in (A), but for 16 S1 non-RBD-binding nanobodies. (C) As in (A), but for 19 S2-binding nanobodies. (D) A network visualization of anti-S1-RBD nanobodies. Each node is a nanobody and each edge is a response value measured by biolayer interferometry from pairwise cross-competition assays. Orange nodes represent 11 nanobodies used as a representative panel for clustering analysis in (A). Blue nodes represent the other nanobodies in the dataset. The average shortest distance between any nanobody pair in the dataset is 1.64. An average clustering coefficient of 0.831 suggests that the measurements are well distributed across the dataset. The small world coefficient of 1.031 indicates that the network is more connected than to be expected from random, but the average path length is what you would expect from a random network, together indicating that the relationship between nanobody pairs not actually measured can be inferred from the similar/neighboring nanobodies. (E, F) As in (D) but for S1 non-RBD and S2 nanobodies, respectively. These are complete networks with every nanobody measured against the others in the dataset. (G) Mass photometry (MP) analysis of spike S1 monomer incubated with different anti-spike S1 nanobodies. Two examples of an increase in mass as spike S1 monomers (black line) are incubated with 1–3 nanobodies. The accumulation in mass upon addition of each different nanobody on spike S1 monomer is due to each nanobody binding to non-overlapping space on spike S1, an observation consistent with Octet binning data. As a control, using MP, each individual nanobody was shown to bind spike S1 monomers on its own (data not shown).


