. 2021 Nov 3;10:e66194. doi: 10.7554/eLife.66194

Figure 2. The apex of CAD in ctSTIM1 deviates from the CAD crystal structure.

(A) Representative smFRET recording at the base of CAD (431:431´) showing stable, high FRET. (B) Ensemble density plots of the initial 2 s of inter-subunit smFRET recordings for sites throughout CAD. Predominant FRET levels are shown by arrowheads to the right of each plot. (C–D) Comparison of inter-fluorophore distances from smFRET and the CAD crystal structure. Simulated fluorophores are represented by the average position of a central atom, indicated here as ball-on-stick models (see Materials and methods). For sites near the dimer interface (the 'base' of CAD, C), the smFRET-derived distances (black bars) agree closely with the crystal structure (white bars). Measurements in the apex (D) deviate from the crystal structure. (E) Modified structure (red) generated by a smFRET-constrained optimization of the crystal structure (gray). Outward rotation of the distal CC2 region (aa 379–391) around G379 as a pivot point restored close correspondence between smFRET-derived distances and the crystal structure (bottom). (F) Representative example of smFRET fluctuations in the CAD apex (388:388´).

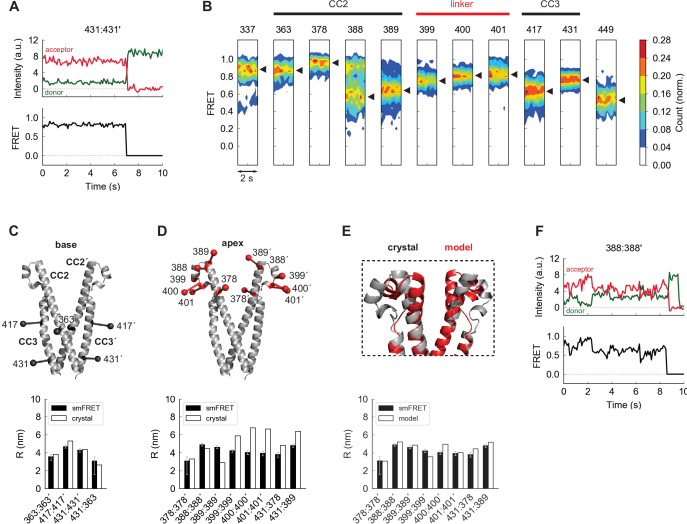
Figure 2.

Figure 2—figure supplement 1. CAD apex structure.

Figure 2—figure supplement 1.

(A) Dimerization of ctSTIM1 cysteine mutants by disulfide bond formation in CAD, shown by non-reducing SDS-PAGE. CuP-induced dimerization was virtually absent at basal sites but was evident at all tested sites in the apical region. (B) Analysis of external contacts of a CAD subunit in the reconstructed crystal lattice. In the left panel a subunit of CAD is shown in red, the adjacent subunit in the dimer is shown in transparent pink, and interacting subunits in the crystal lattice are shown in transparent gray. The crystal lattice was generated from structural coordinates in 3TEQ.pdb using Chimera software (Pettersen et al., 2004). Residues on the red subunit that are in contact with the external crystal lattice (including the paired subunit) are shown in yellow, and their corresponding contacts in the external lattice are shown in blue. Contacts are defined as sites where Van der Waals radii touch or overlap. Extensive external contacts are made at the base of CAD, near the dimer interface, and at the apex in the CC2-CC3 linker region. The enlargement on the right shows lattice contacts throughout virtually the entire apex. Polar contacts (hydrogen bonds) are shown as dashed orange lines.
Figure 2—figure supplement 1—source data 1. Raw unedited gel for Figure 2—figure supplement 1A (ctSTIM1 CAD cysteine crosslinking).
Figure 2—figure supplement 1—source data 2. Uncropped labeled gel for Figure 2—figure supplement 1A (ctSTIM1 CAD cysteine crosslinking).