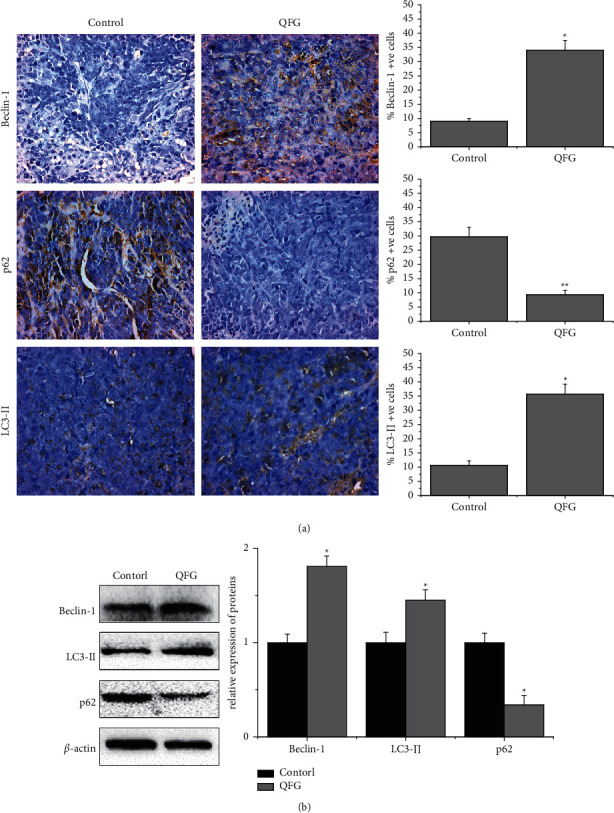
Figure 3.

The expression of LC3-II, beclin-1, and p62 in tumor cells of CRC xenograft mice in each group. (a) Immunohistochemistry stain (400×). Quantification of IHC assays were represented as percentage of positively stained cells ( ± S, n = 6). (b) Protein expression detected by western blot ( ± S, n = 4). β-Actin was used as the internal control. ∗P < 0.05 and ∗∗P < 0.01, QFG treatment group vs. control group.
