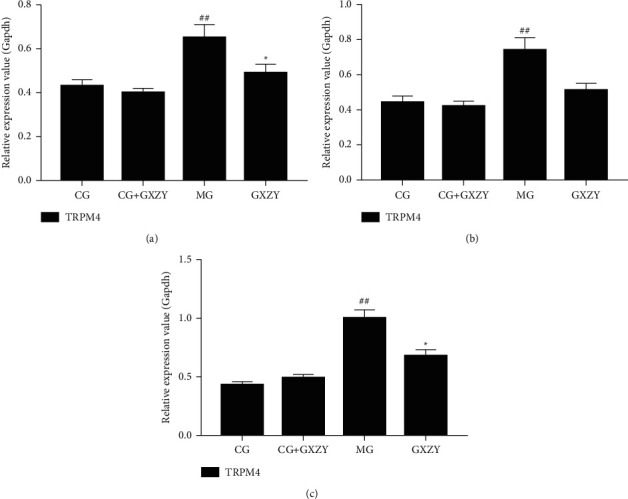
Figure 10.

Comparison of the TRPM4 mRNA expression in the liver at the three stages of NAFLD. (a) NAFL group. (b) NASH group. (c) Nonalcoholic fatty liver fibrosis. Compared with the control group, ##P < 0.01; compared with the model group, ∗P < 0.05.
