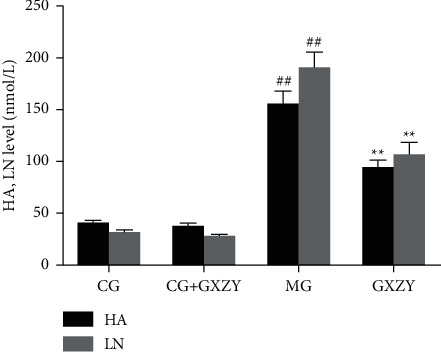
Figure 7.

Changes in (A) HA and (B) LN levels after the Gexia Zhuyu decoction administration. Compared with the control group (CG-fibrosis, 39.63 ± 3.31 nmol/L and 30.35 ± 3.21 nmol/L, n = 10), ##P < 0.01; compared with the model group (MG-fibrosis, 154.51 ± 13.09 nmol/L and 189.57 ± 15.75 nmol/L, n = 10), ∗∗P < 0.01. HA, hyaluronic acid; LN, laminin.
