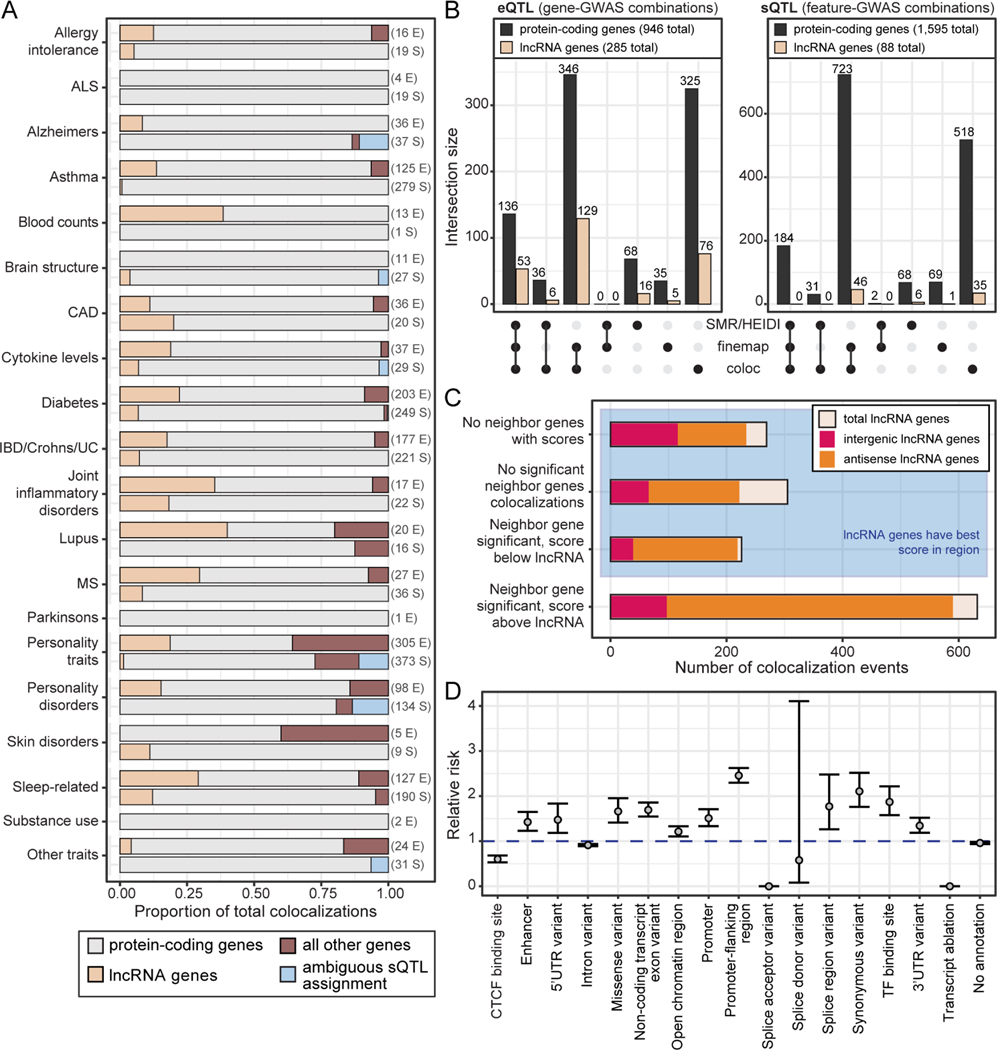
Figure 5.
GWAS-QTL colocalization identifies trait-associated lncRNA genes.
(A) Contribution of each gene type to significant colocalization events, collapsed across tissues (feature-GWAS combinations). GWAS were grouped on the y-axis by general trait categories. For each trait category, the top bar shows eQTL colocalizations and the bottom bar shows sQTL colocalizations. If a bar is missing from the plot, there were no colocalizations for that given trait category and QTL type. The numbers to the right of each bar are the total number of significant colocalization events (E: eQTL, S: sQTL).
(B) Number of significant colocalization events collapsed across tissues (feature-GWAS combinations) for each approach.
(C) Significant lncRNA colocalization events (feature-GWAS-tissue combinations) grouped by the colocalization status of protein-coding genes in the surrounding 1Mb range.
(D) Enrichment of variant annotation categories in the 95% credible sets of all significant lncRNA colocalization events discovered by FINEMAP. Enrichment was calculated relative to all GTEx variants that were not within the credible set and were within 400kb of an annotated gene. Dots represent relative risk point estimate, with bars showing the 95% confidence intervals.

