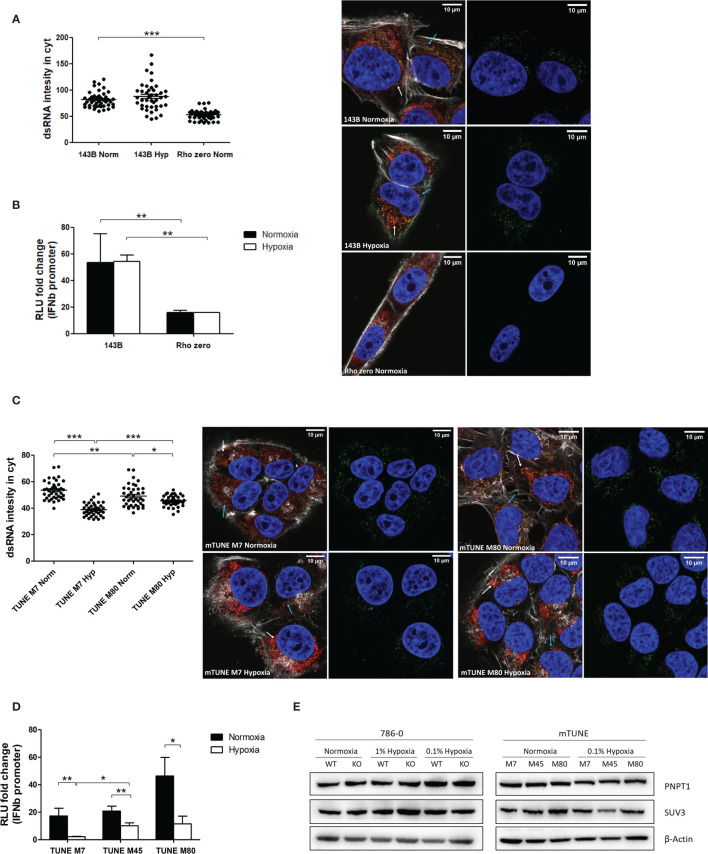
Figure 3.
Mitochondrial alterations did not affect dsRNA staining reduction under hypoxia. (A) Representative images showing dsRNA staining using J2 antibody in 143B WT cells in normoxia (n=44 cells) or 0.1% hypoxia (n=42 cells) for 48h and in 143B lacking mtDNA (Rho Zero) exposed to normoxia (n=40 cells) from 3 independent replicates. (B) IFNβ promoter stimulation was evaluated using RNA from 143B WT and Rho Zero cells cultured in normoxia and 0.1% hypoxia for 48h (n=3; RLU, relative light units). (C) Representative images showing dsRNA staining in U2OS isogenic lines harbouring 7% vs 80% of heteroplasmy for the mtDNA mutation m8993T>G (mTUNE M7 normoxia n=40 cells and 0.1% hypoxia n=40 cells, M80 normoxia n=40 cells and 0.1% hypoxia n=40 cells) from 3 independent replicates. (D) IFNβ promoter stimulation using RNA from mTUNE M7, M45 and M80 cells in normoxia and 0.1% hypoxia for 48h (n=3). (E) Western blot showing PNPT1 and SUV3 dsRNA degrading enzymes protein levels in normoxia and hypoxia (n=3). Number of replicates indicate biological replicates and data is shown as mean ± SEM. *p < 0.05, **p < 0.01, ***p < 0.001. Green: J2 antibody staining, blue: DAPI, and red: MitoTracker staining. White arrow: dsRNA inside of mitochondria, blue arrow: dsRNA outside of mitochondria. Scale bars correspond to 10μm.

