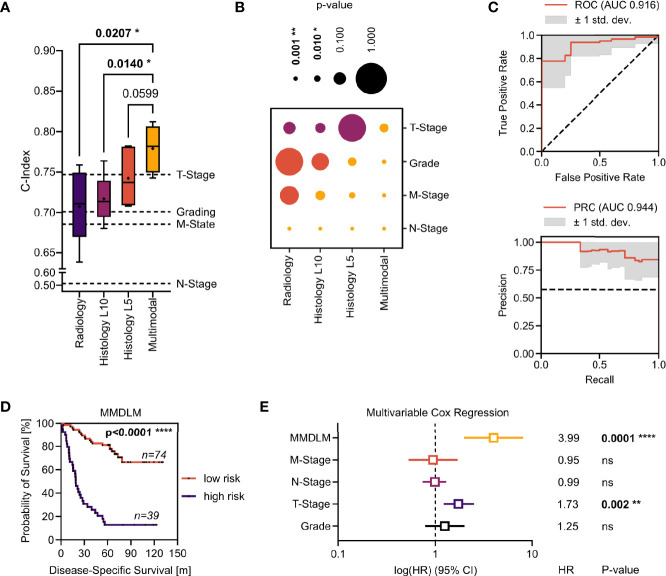
Figure 2.
Evaluation of the MMDLM for prognosis prediction in ccRCC. (A) C-index distribution of 6-fold cross validation. Dotted lines represent the C-index of the respective clinical attribute (Grading, T-Stage, N-Stage, M-Stage) of the whole cohort. RM one-way ANOVA with post-hoc Tukey HSD to correct for multiple comparisons was used to compare the groups. (B) P-value matrix of one-sample t test of each modality vs. each risk factor (yellow: significantly. higher, orange: higher, purple: lower). (C) Mean ROC (top) and PR curve (bottom) of 12-fold cross validation. (D) Kaplan–Meier-Curve after stratification according to 5YSS by the MMDLM. (E) Forrest plot of multivariable Cox regression. HR, hazard ratio; CI, Confidence interval; Ns, not significant. *p = 0.01–0.05, **p = 0.001–0.01, ****p < 0.0001

