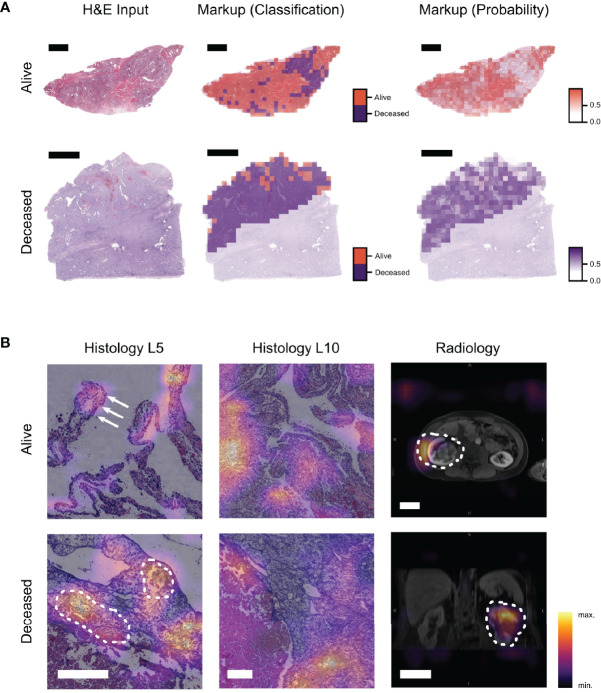
Figure 4.
Visualization techniques show image regions important for the prediction and their contribution to the MMDLM. (A) Example of a visualization approach to display the classification result of a unimodal histopathology model (ResNet18—Level 5). The input WSI as well as two different markup images are displayed. Markup all denotes the distinction between tiles classified as alive or deceased. Markup class denotes the prediction certainty within the majority class (scalebar top row: 4 mm, scalebar bottom row: 5 mm). (B) CAMs of the MMDLM are shown. Different features associated with low-risk (alive) and high-risk (deceased) are highlighted. In the low-risk example, clear cell morphology as well as papillary tumor appearance (arrows) can be observed. In the high-risk example, tumor vasculature and bleeding can be observed (dotted line) (scalebar histology: 250 µm, scalebar radiology: 5 cm).

