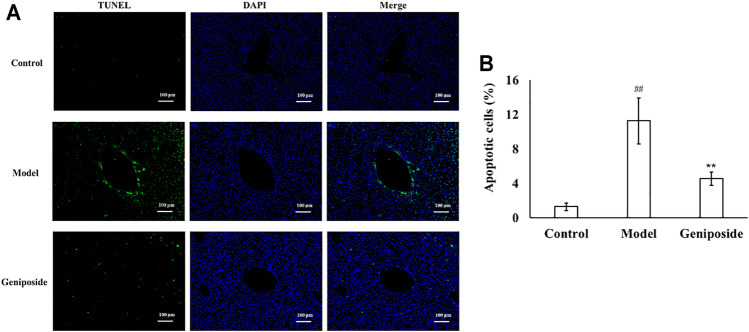
FIGURE 5.
Geniposide treatment improved apoptosis in liver fibrosis model mice. (A) Changes of TUNEL staining. (B) Changes of quantitative analysis of apoptotic cells. (A,B) TUNEL staining indicated that geniposide treatment reduced the number of apoptotic cells in a liver section. Control, model, and geniposide groups (n = 10 per group). Data are presented as mean ± SD. ## p < 0.01, Model group vs. Control group; ∗∗ p < 0.01, Geniposide group vs. Model group.

