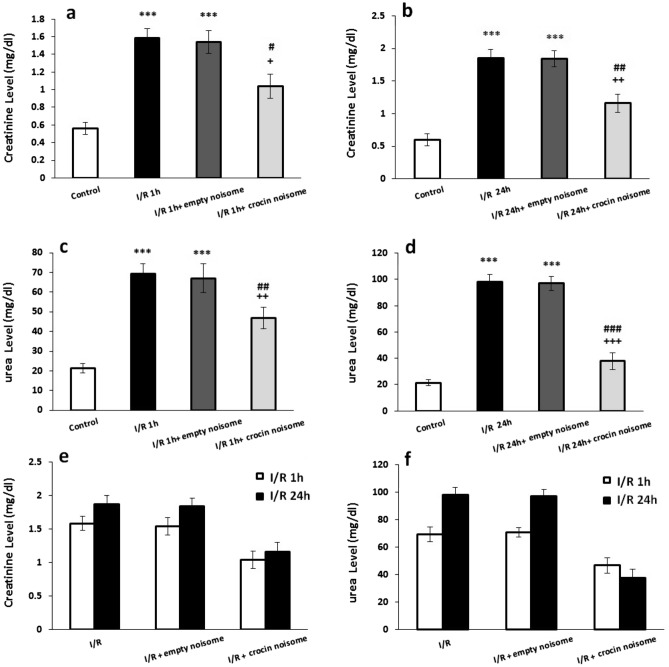
Figure 4.
The effect of crocin-loaded nanoniosomes on (a) 1 h after I/R-induced changes in creatinine serum level, (b) 24 h after I/R-induced changes in creatinine serum level, (c) 1 h after I/R-induced changes in urea serum level, (d) 24 h after I/R-induced changes in urea serum level, (e) comparison ischemia-induced changes followed by 1 h and 24 of reperfusion in creatinine serum level and (f) comparison ischemia-induced changes followed by 1 h and 24 of reperfusion in urea serum level. Data presented as mean ± SEM. ***P < 0.001 and versus control group; +P < 0.05, ++P < 0.01and +++P < 0.001 versus I/R group; #P < 0.05, ##P < 0.01 and ###P < 0.001 versus I/R + empty niosome group.

