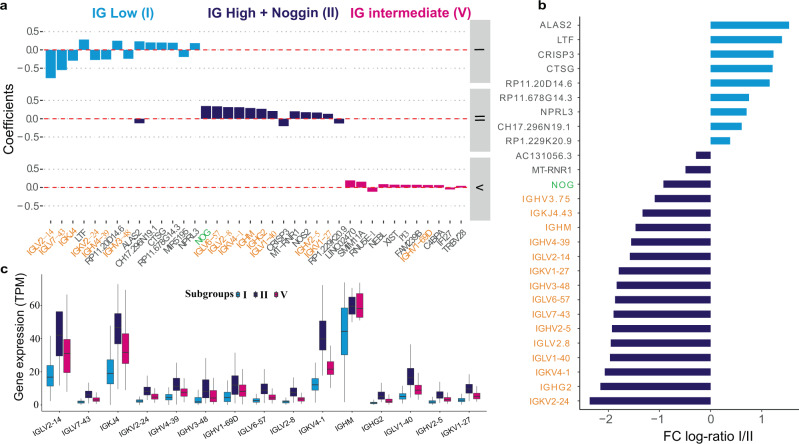
Fig. 3. Genes associated with subgroups I (low survival), II (high survival) and V (intermediate survival).
a Genes with the highest 5% of LASSO coefficients across subgroups I, II and V. b Average expression fold change (log2 scaled) of the signature genes between subgroup I and II, with significance notations. Genes over-expressed in subgroup I are denoted by light blue bars while genes primarily expressed in subgroup II are represented by dark blue bars. c Expression level of immunoglobulin genes selected by LASSO across the three predominant subgroups with medians shown. Subgroups I (n = 134), V (n = 98) and II (n = 119) can be defined as having low, intermediate and high immunoglobulin characteristics. Vertical centre line represents the median, top and bottom bounds of the box represent the first and third quartile, while the tips of the whiskers represent min and max values.

