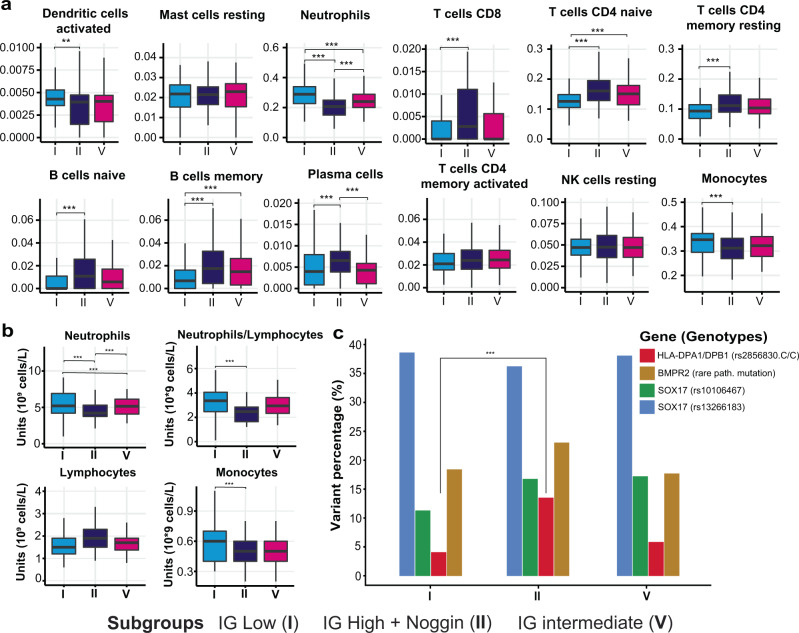
Fig. 4. Immunity cell composition across PAH transcriptomic subgroups.
a CIBERSORT estimation of relative cell abundance in patients of subgroups I (n = 129), II (n = 112) and V (n = 89) using two-sided test and Bonferroni adjusted mean difference significance notation with p values: pI-II(Dendritic cells activated) = 0.011, pI-II(Neutrophils) = 4.4 × 10⁻¹¹, pI-V(Neutrophils) = 2.0 × 10⁻³, pII-V(Neutrophils) = 1.7 × 10⁻³, pI-II(T cells CD8) = 4.8 × 10⁻⁵, pI-II(T cells CD4 naive) = 1.9 × 10⁻⁸, pI-V(T cells CD4 naive) = 3.8 × 10⁻³, pI-II(T cells CD4 memory resting) = 2.3 × 10⁻⁵, pI-II(B cells naive) = 2 × 10⁻⁵, pI-II(B cells memory) = 2.5 × 10⁻⁶, pI-V(B cells memory) = 3.9 × 10⁻³, pI-II(Plasma cells) = 6.4 × 10⁻⁴, pII-V(Plasma cells) = 6.5 × 10⁻⁵ and pI-II(Monocytes) = 0.0053. Vertical centre line represents the median, top and bottom bounds of the box represent the first and third quartile, while the tips of the whiskers represent min and max values. b Whole-blood cell counts across subgroups I (n = 129), II (n = 112) and V (n = 89) using two-sided test and Bonferroni adjusted mean difference significance notation. pI-II (Neutrophils) = 7.2 × 10⁻¹², pI-V (Neutrophils) = 8.0 × 10⁻⁴, pII-V (Neutrophils) = 4.4 × 10⁻⁴, pI-II (Neutrophils/Lymphocytes) = 0.0061 and pI-II (monocytes) = 0.0076. Vertical centre line represents the median, top and bottom bounds of the box represent the first and third quartile, while the tips of the whiskers represent min and max values. c Proportion of patients in each subgroup with DNA variants in HLA-DPA1/DPB1 (rs2856830), SOX17 (rs10106467 and rs13266183, homozygous and heterozygous), BMPR2 (rare pathogenic variant). Notably, pI-II (HLA-DPA1/DPB1) = 0.009. Generated using a two-sample test for equality of proportions with continuity correction. *P value ≤ 0.05, **p value ≤ 0.01, ***p value ≤ 0.001.

